Fig. A.7.
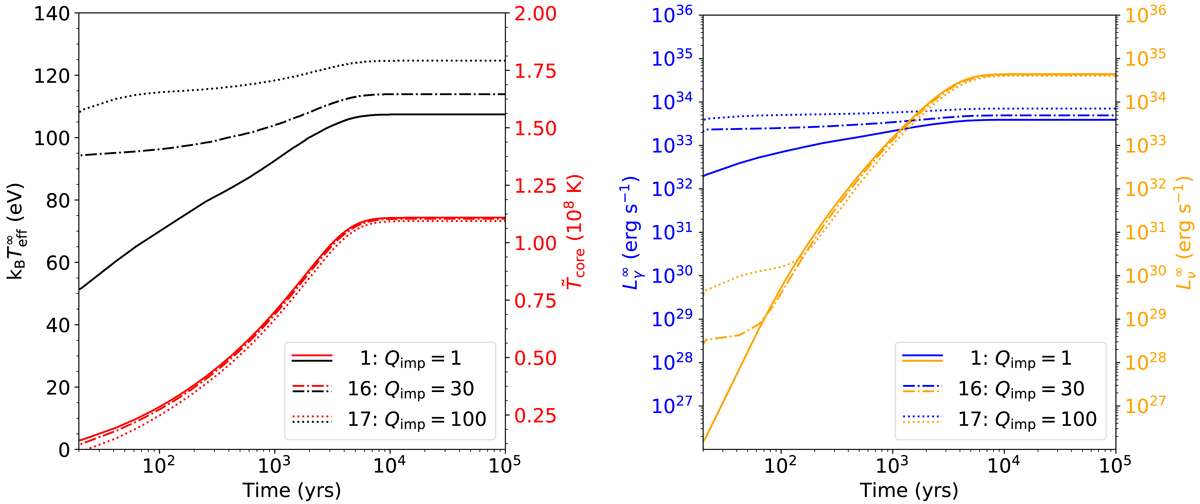
Same as Fig. A.1, but for different impurity factor in the (full) crust. In model 1 a crust with high thermal conductivity is assumed (Qimp = 1, solid lines), in model 16 the thermal conductivity in the crust is decreased by increasing the impurity parameter to 30 (dash-dotted lines), and Qimp = 100 is assumed throughout the crust in model 17. The plotted quantities here are taken when the neutron star is still in the crust-cooling phase, which causes the effective temperatures and photon luminosities for the models with lower thermal conductivity (16 and 17) to be higher, even though the core temperature in these models is lower. This is because for lower thermal conductivity, the crust takes longer to cool down after an outburst. If the quantities had been taken when the source was in crust-core equilibrium (∼103−4 days after the end of an outburst), the neutron stars with lower core temperature would have lower surface temperatures and photon luminosities.
Current usage metrics show cumulative count of Article Views (full-text article views including HTML views, PDF and ePub downloads, according to the available data) and Abstracts Views on Vision4Press platform.
Data correspond to usage on the plateform after 2015. The current usage metrics is available 48-96 hours after online publication and is updated daily on week days.
Initial download of the metrics may take a while.