Fig. 1.
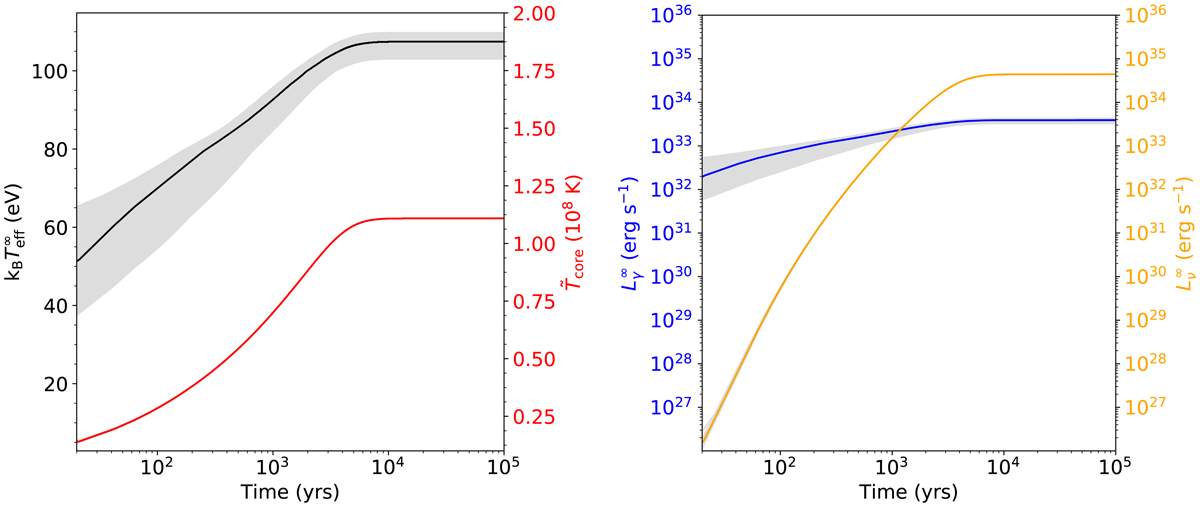
Results of the basic model. Left: evolution of the effective temperature (black) and core temperature (red) as function of time for our basic model. Right: evolution of the photon luminosity (blue) and neutrino luminosity (orange). All values are redshifted. Plotted are values at the end of the last of the 24 outburst that make up one sequence, at the last step of the quiescent period. The plot thus excludes the variations during outbursts and between the 24 different outbursts of one sequence. The grey band indicates how different the parameters would be if they were taken at the end of the quiescent period after one of the 23 other outbursts in the sequence.
Current usage metrics show cumulative count of Article Views (full-text article views including HTML views, PDF and ePub downloads, according to the available data) and Abstracts Views on Vision4Press platform.
Data correspond to usage on the plateform after 2015. The current usage metrics is available 48-96 hours after online publication and is updated daily on week days.
Initial download of the metrics may take a while.