Free Access
Fig. 8
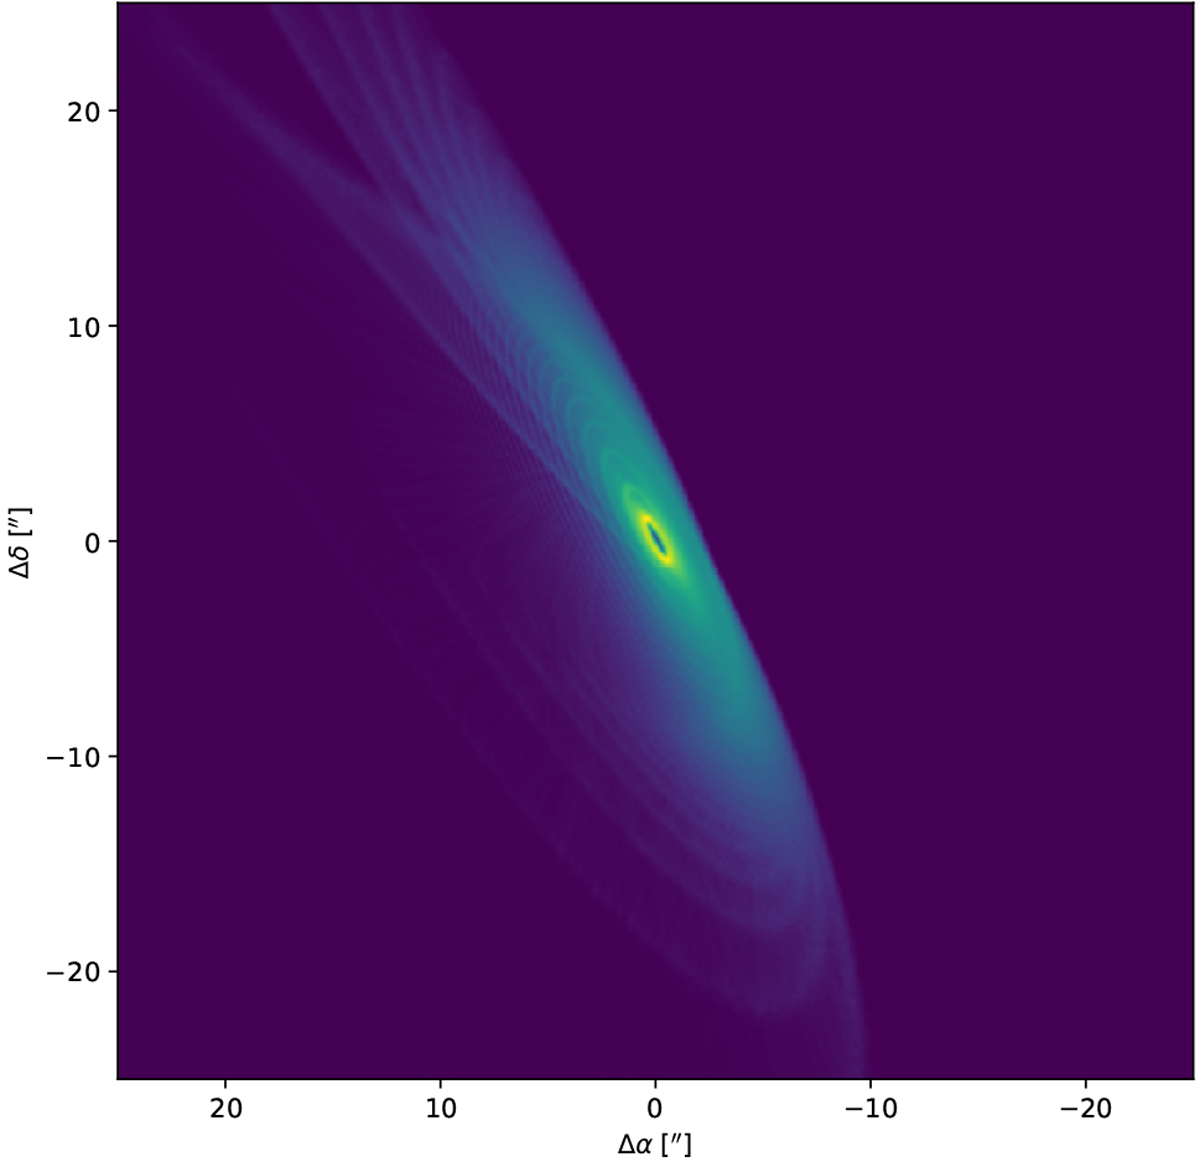
Mock HST observations calculated from the N-body simulations of small, bound, dust grains around HR 4796 A, when considering that the pericenter is precessing over time. The image is in log-scale.
Current usage metrics show cumulative count of Article Views (full-text article views including HTML views, PDF and ePub downloads, according to the available data) and Abstracts Views on Vision4Press platform.
Data correspond to usage on the plateform after 2015. The current usage metrics is available 48-96 hours after online publication and is updated daily on week days.
Initial download of the metrics may take a while.