Free Access
Fig. 4
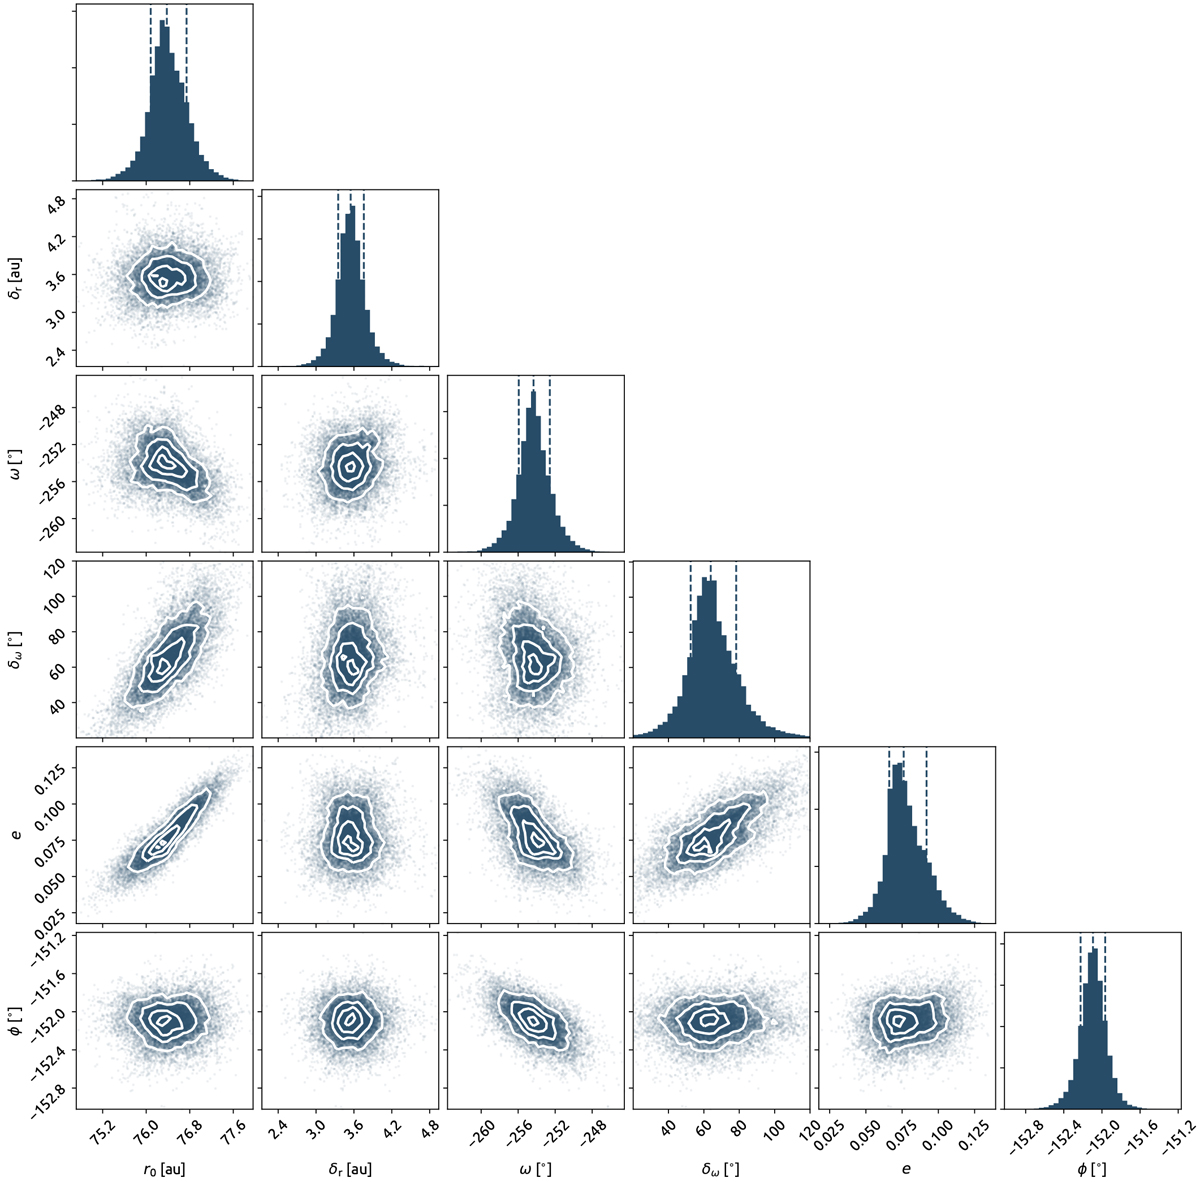
Projected probability density distributions along with the determined uncertainties for the different parameters in the modeling as well as density plots. The contours correspond to the [0.12, 0.39, 0.68, 0.86] density percentiles.
Current usage metrics show cumulative count of Article Views (full-text article views including HTML views, PDF and ePub downloads, according to the available data) and Abstracts Views on Vision4Press platform.
Data correspond to usage on the plateform after 2015. The current usage metrics is available 48-96 hours after online publication and is updated daily on week days.
Initial download of the metrics may take a while.