Fig. 16.
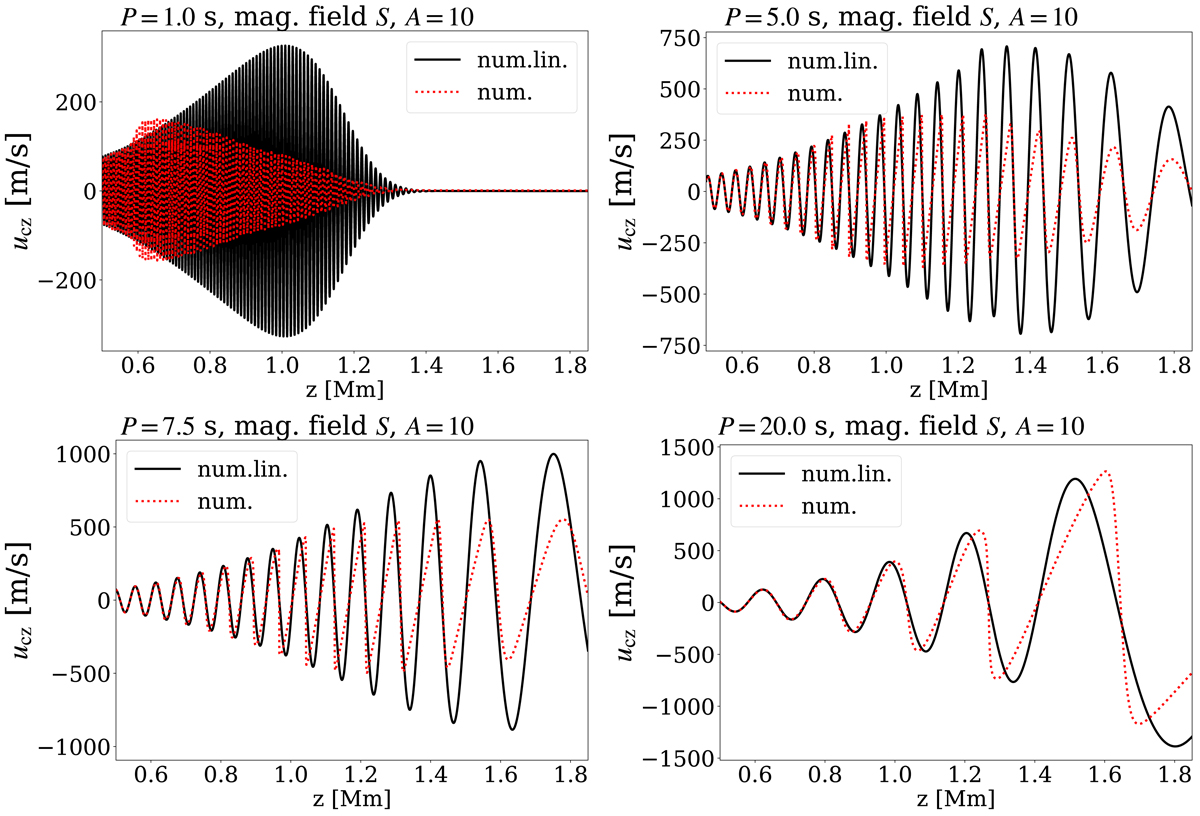
Comparison between numerical solution in linear regime (black lines) and nonlinear regime (red dotted line) with A = 10. Individual panels show snapshots of the velocity of charges as a function of height at fixed time moments in the stationary regime of the simulations. Panels from left to right, from top to bottom are for wave periods of 1, 5, 7.5, and 20 s, and S magnetic field profile.
Current usage metrics show cumulative count of Article Views (full-text article views including HTML views, PDF and ePub downloads, according to the available data) and Abstracts Views on Vision4Press platform.
Data correspond to usage on the plateform after 2015. The current usage metrics is available 48-96 hours after online publication and is updated daily on week days.
Initial download of the metrics may take a while.