Fig. 15.
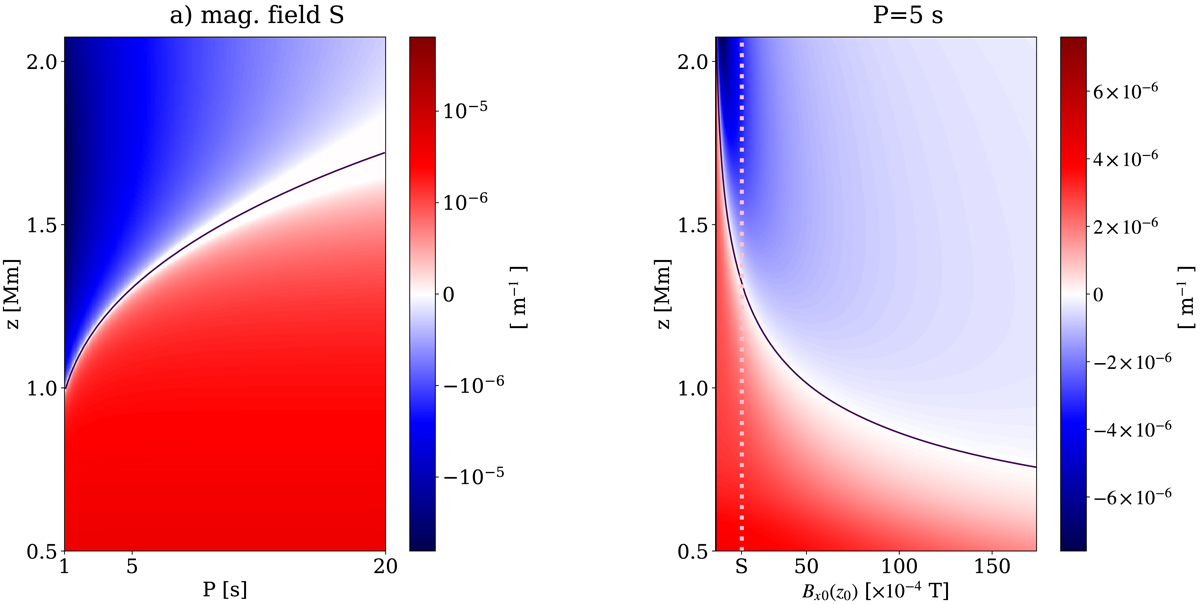
Left panel: imaginary part of k as function of wave period (horizontal axis) and height (vertical axis) obtained after solving dispersion relation for two-fluid equations (Eq. (36)) for S magnetic field profile. Solution #3 from Fig. 13 is used. The period varies between 1 s and 20 s (the minimum and maximum values used in the simulations). The solid, black line represents the contour of kI = 0. Right panel: imaginary part of k as function of background magnetic field at base of atmosphere (horizontal axis) and height (vertical axis). The wave period is fixed to 5 s.
Current usage metrics show cumulative count of Article Views (full-text article views including HTML views, PDF and ePub downloads, according to the available data) and Abstracts Views on Vision4Press platform.
Data correspond to usage on the plateform after 2015. The current usage metrics is available 48-96 hours after online publication and is updated daily on week days.
Initial download of the metrics may take a while.