Fig. 9.
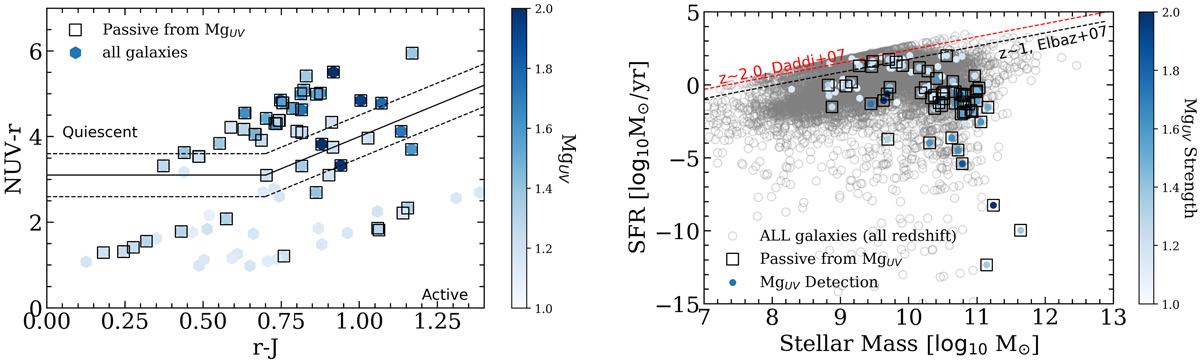
Left: NUVrJ color-color diagram for all our selected galaxies. The value of MgUV galaxies in our sample is color-coded. We identify the galaxies selected as passive using the MgUV index only by empty black squares. The passive region (black solid and dashed line) is taken from Davidzon et al. (2017). Right: position of our galaxies in the M-SFR diagram. We show in gray all the galaxies from VVDS deep and ultra deep sample (at all redshift) for comparison. We also show the main sequence fit at z ∼ 1 and 2 from Elbaz et al. (2007) and Daddi et al. (2007), respectively. Our selected galaxies are shown in color representing the MgUV strength.
Current usage metrics show cumulative count of Article Views (full-text article views including HTML views, PDF and ePub downloads, according to the available data) and Abstracts Views on Vision4Press platform.
Data correspond to usage on the plateform after 2015. The current usage metrics is available 48-96 hours after online publication and is updated daily on week days.
Initial download of the metrics may take a while.