Fig. 6.
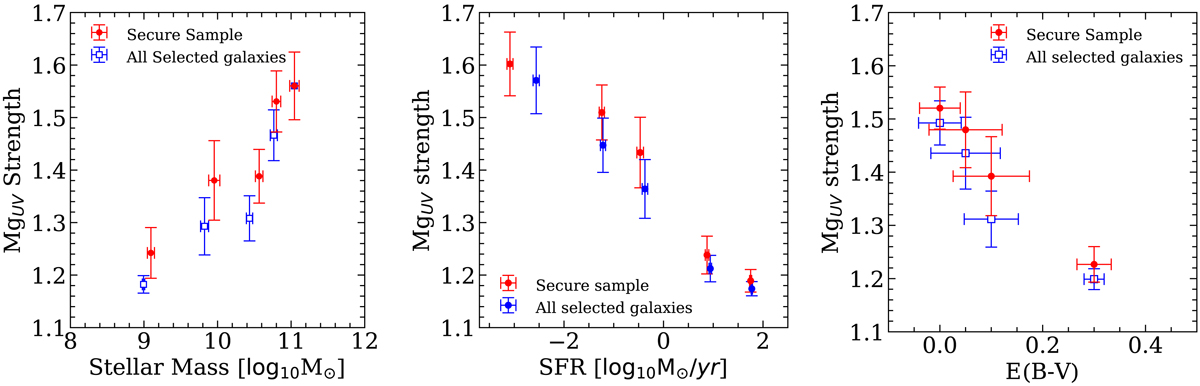
Relationship between physical parameters computed from the SED-fitting based on photometric data only and the strength of MgUV computed from the SED-fitting of the spectroscopic data only. From left to right: stellar mass, SFR, and dust extinction. The errors shown on each plot represent the errors on the mean. In each panel we give the evolution for the full sample of 103 galaxies (blue) and also the evolution for the secure sample only (75 galaxies, in red).
Current usage metrics show cumulative count of Article Views (full-text article views including HTML views, PDF and ePub downloads, according to the available data) and Abstracts Views on Vision4Press platform.
Data correspond to usage on the plateform after 2015. The current usage metrics is available 48-96 hours after online publication and is updated daily on week days.
Initial download of the metrics may take a while.