Free Access
Fig. 5.
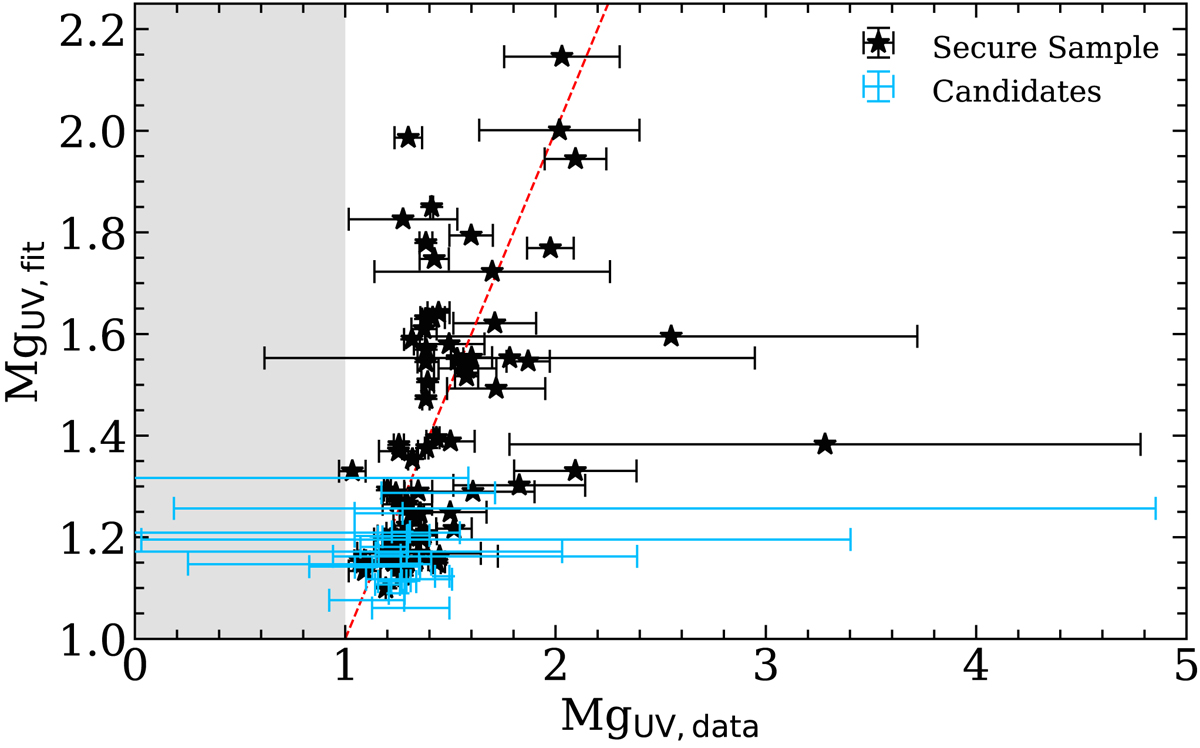
Comparison of the MgUV strength computed from the data and from the best spectral fit. The gray region represent the forbidden area with no detection of MgUV, data in the data. The red dashed line shows the 1:1 relation.
Current usage metrics show cumulative count of Article Views (full-text article views including HTML views, PDF and ePub downloads, according to the available data) and Abstracts Views on Vision4Press platform.
Data correspond to usage on the plateform after 2015. The current usage metrics is available 48-96 hours after online publication and is updated daily on week days.
Initial download of the metrics may take a while.