Fig. 3.
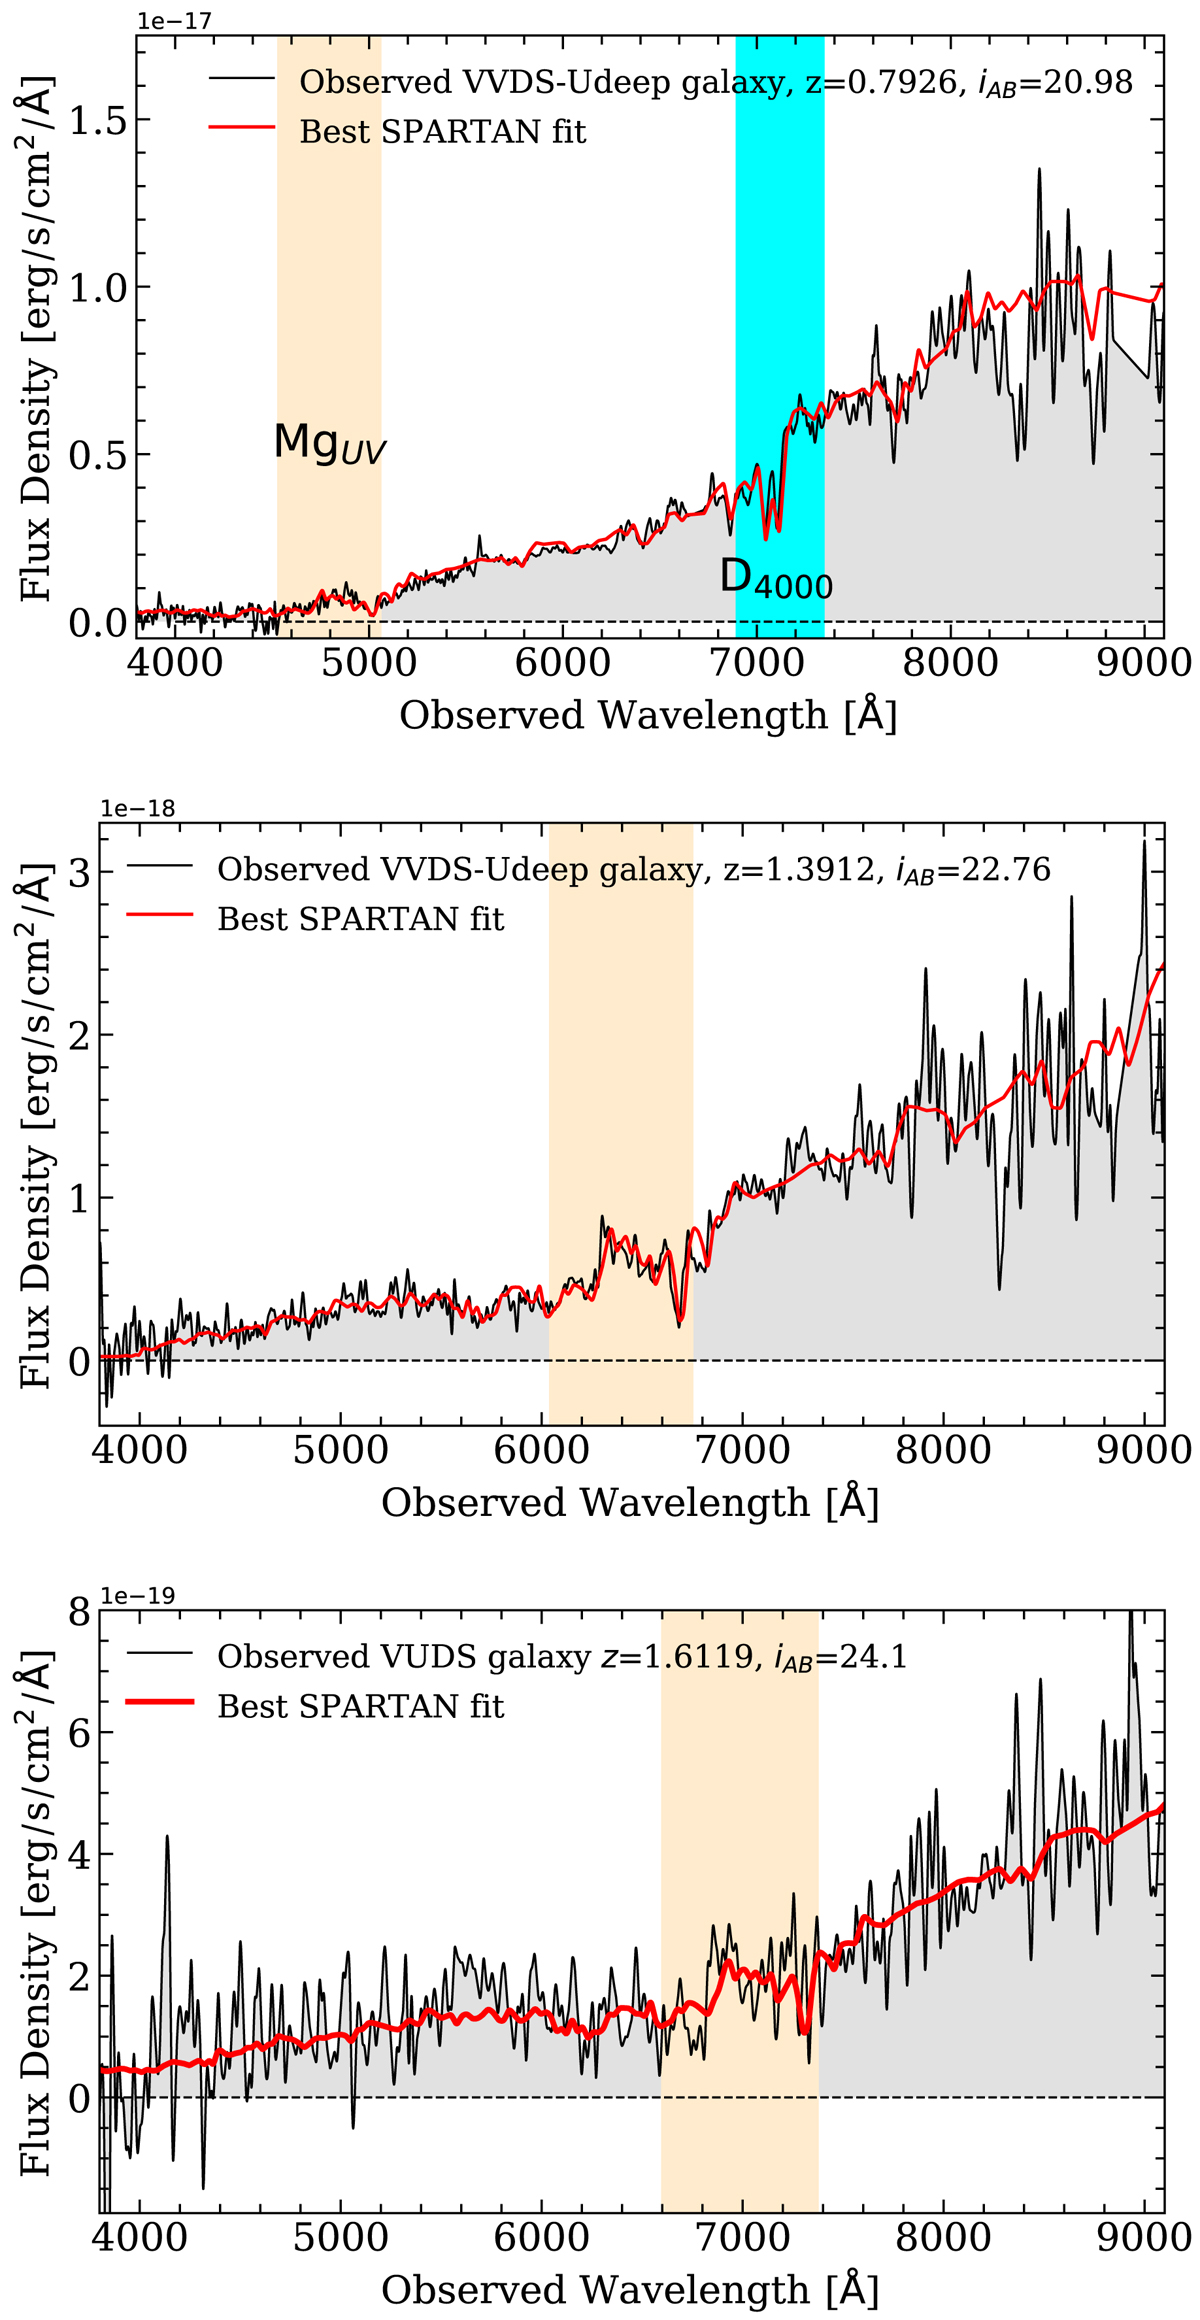
Example of selected MgUV-selected galaxies at three different redshifts. For each galaxy the black line shows the observed spectrum, the red line the best fit from SPARTAN. We show with a light yellow strip the location of the MgUV index. When available, we also indicate the position of the D4000 break with a blue vertical strip. The two bottom plots contain galaxies with an assigned redshift quality flag of 1 and would have therefore been missed if low-redshift flag galaxies had been taken out of the selection from the beginning.
Current usage metrics show cumulative count of Article Views (full-text article views including HTML views, PDF and ePub downloads, according to the available data) and Abstracts Views on Vision4Press platform.
Data correspond to usage on the plateform after 2015. The current usage metrics is available 48-96 hours after online publication and is updated daily on week days.
Initial download of the metrics may take a while.