Fig. 4
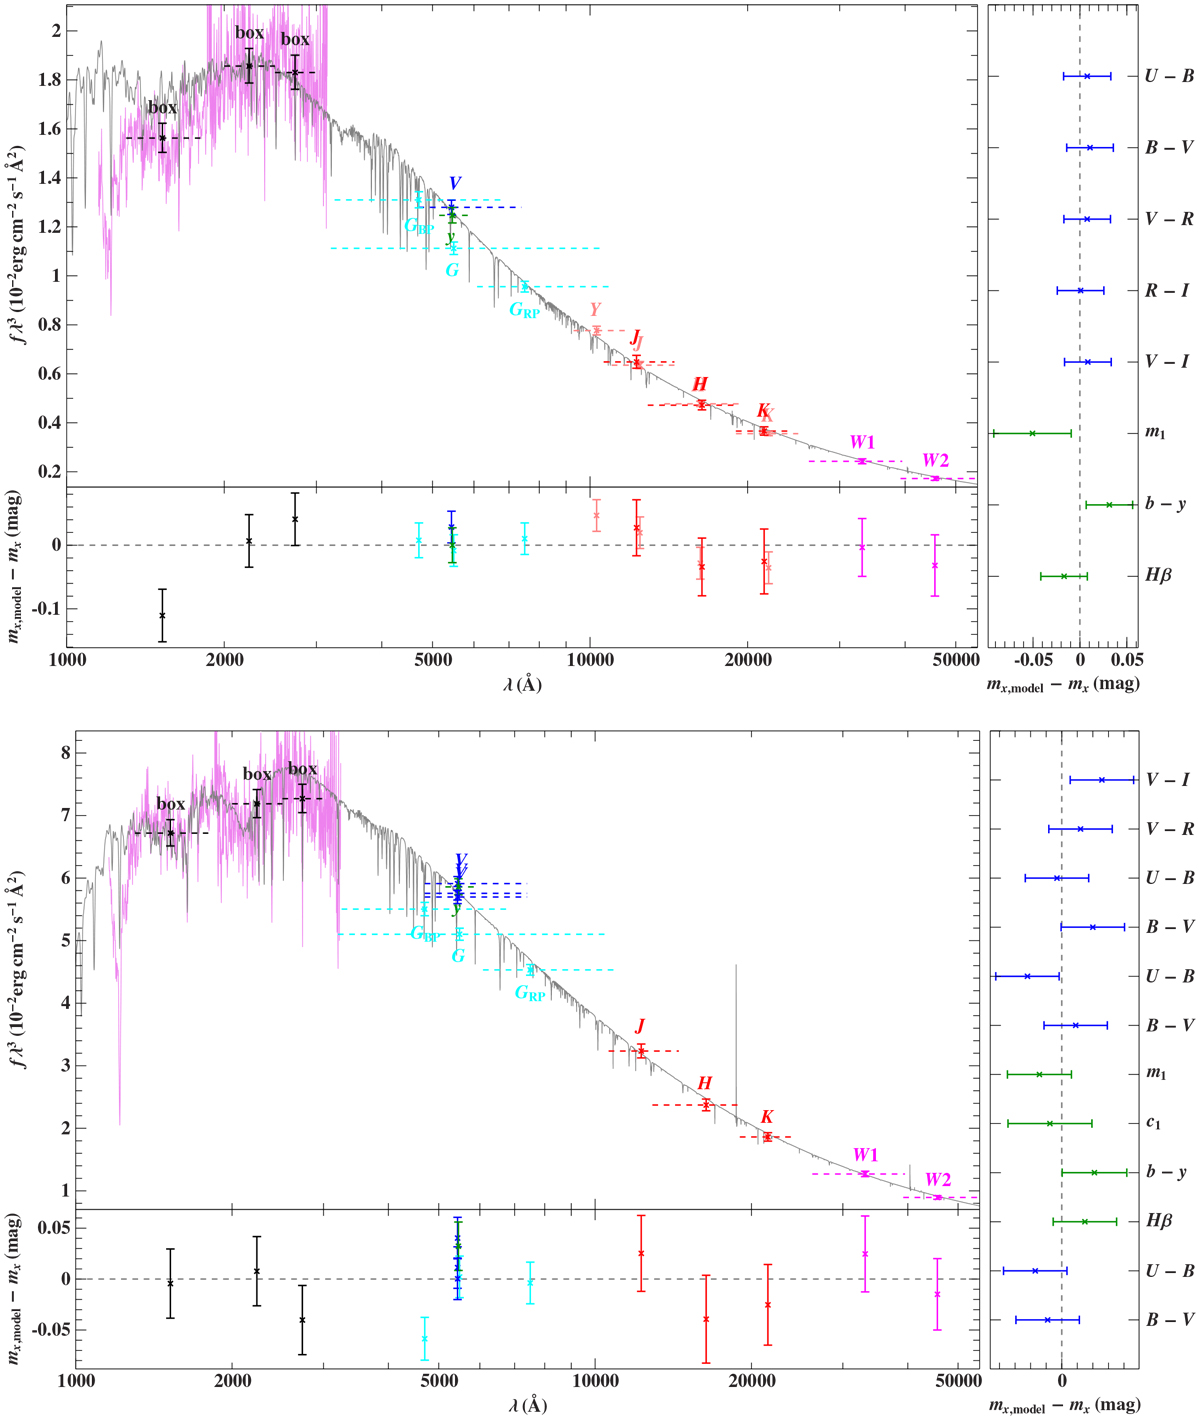
Comparison of synthetic spectra with photometric data for HZ 44 (top) and HD 127493 (bottom). The three black data points labeled “box” are binned fluxes from a low-dispersion IUE spectrum. Filter-averaged fluxes are shown as colored data points that were converted from observed magnitudes (the dashed horizontal lines indicate the respective filter widths), while the gray solid line represents a synthetic spectrum using the atmospheric parameters given in Table 2. The residual panels at the bottom and right-hand side show the differences between synthetic and observed magnitudes as well as colors. The following color codes are used to identify the photometric systems: Johnson–Cousins (blue), Strömgren (green), Gaia (cyan), UKIDSS (rose), 2MASS (red), and WISE (magenta).
Current usage metrics show cumulative count of Article Views (full-text article views including HTML views, PDF and ePub downloads, according to the available data) and Abstracts Views on Vision4Press platform.
Data correspond to usage on the plateform after 2015. The current usage metrics is available 48-96 hours after online publication and is updated daily on week days.
Initial download of the metrics may take a while.