Fig. B.1.
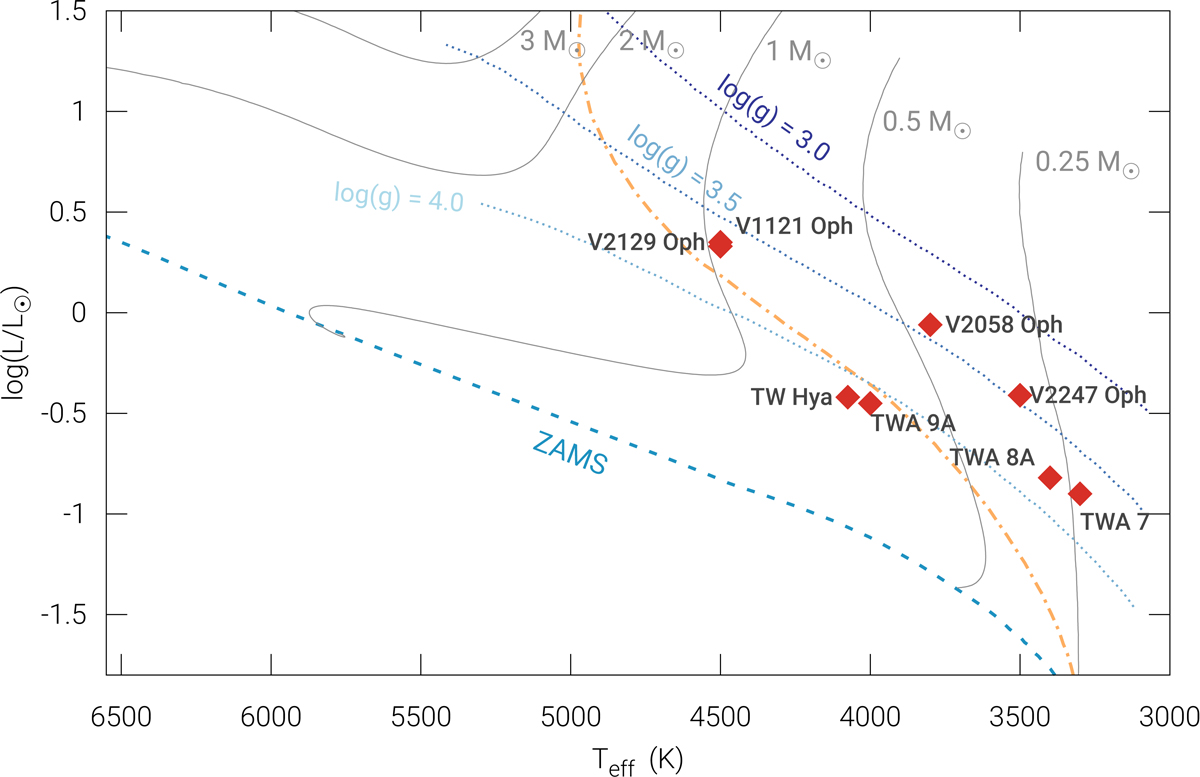
HR diagram used for surface gravity determination. The red diamonds represent the sample of T Tauri stars presented in this paper. The ZAMS is plotted with dashed blue line, the limit between fully and partially convective regimes is shown with the dash-dotted yellow curve. Surface gravity tracks are traced with dotted lines in shades of blue.
Current usage metrics show cumulative count of Article Views (full-text article views including HTML views, PDF and ePub downloads, according to the available data) and Abstracts Views on Vision4Press platform.
Data correspond to usage on the plateform after 2015. The current usage metrics is available 48-96 hours after online publication and is updated daily on week days.
Initial download of the metrics may take a while.