Open Access
Fig. 5.
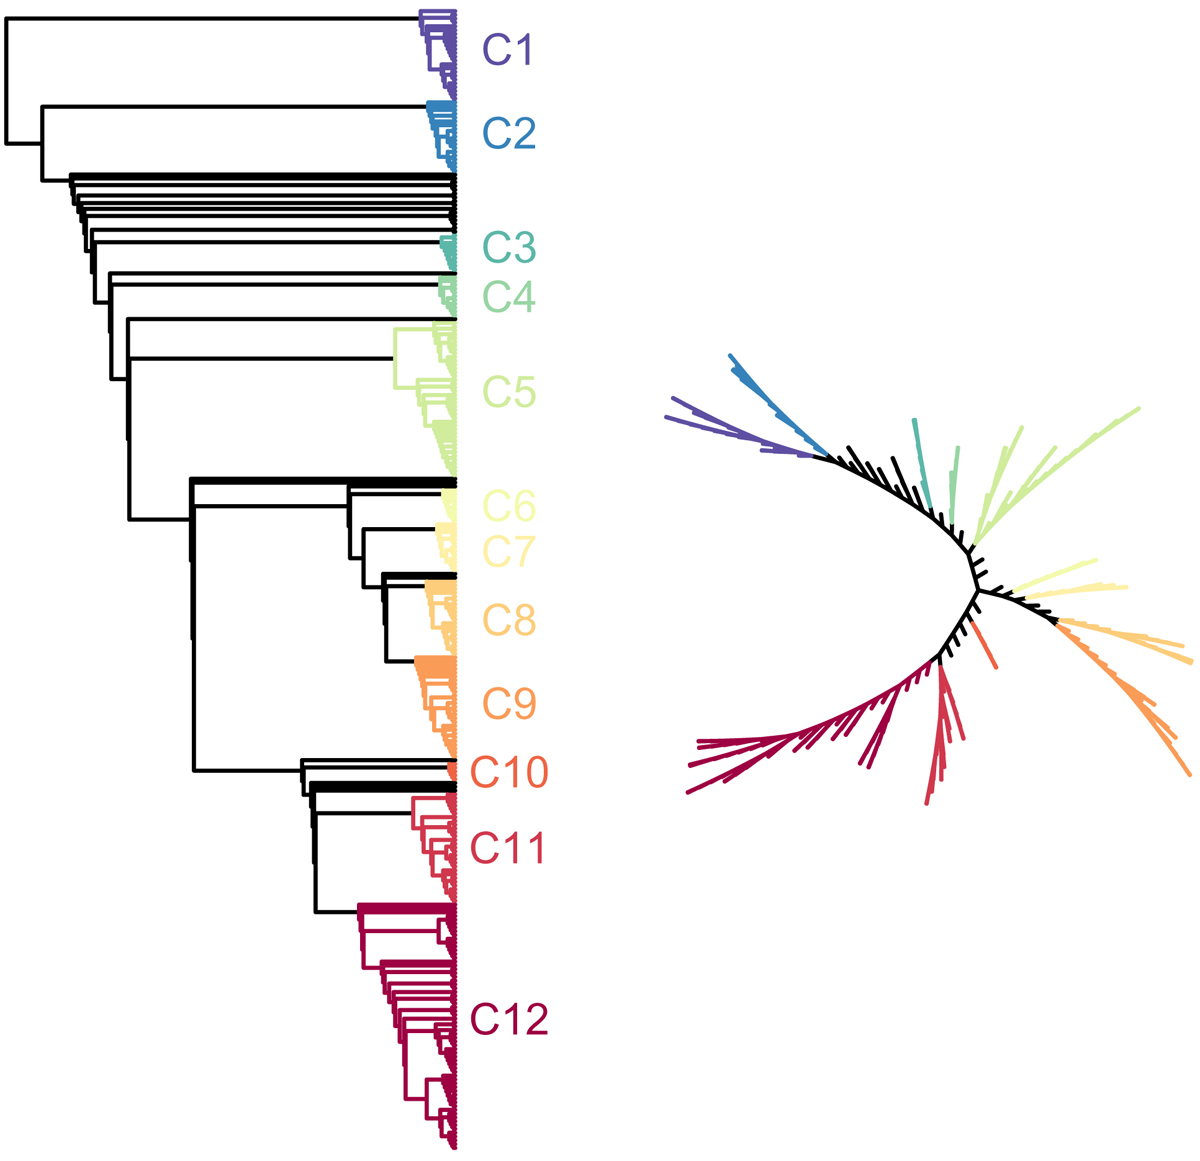
Tree from the analysis with the cluster sample. Only groups with more than 50 galaxies are identified. The tree on the left has been rooted with the group (at the top) that has low values of B − V, nV and log(M*). To the right we show the same tree but unrooted.
Current usage metrics show cumulative count of Article Views (full-text article views including HTML views, PDF and ePub downloads, according to the available data) and Abstracts Views on Vision4Press platform.
Data correspond to usage on the plateform after 2015. The current usage metrics is available 48-96 hours after online publication and is updated daily on week days.
Initial download of the metrics may take a while.