Fig. B.1.
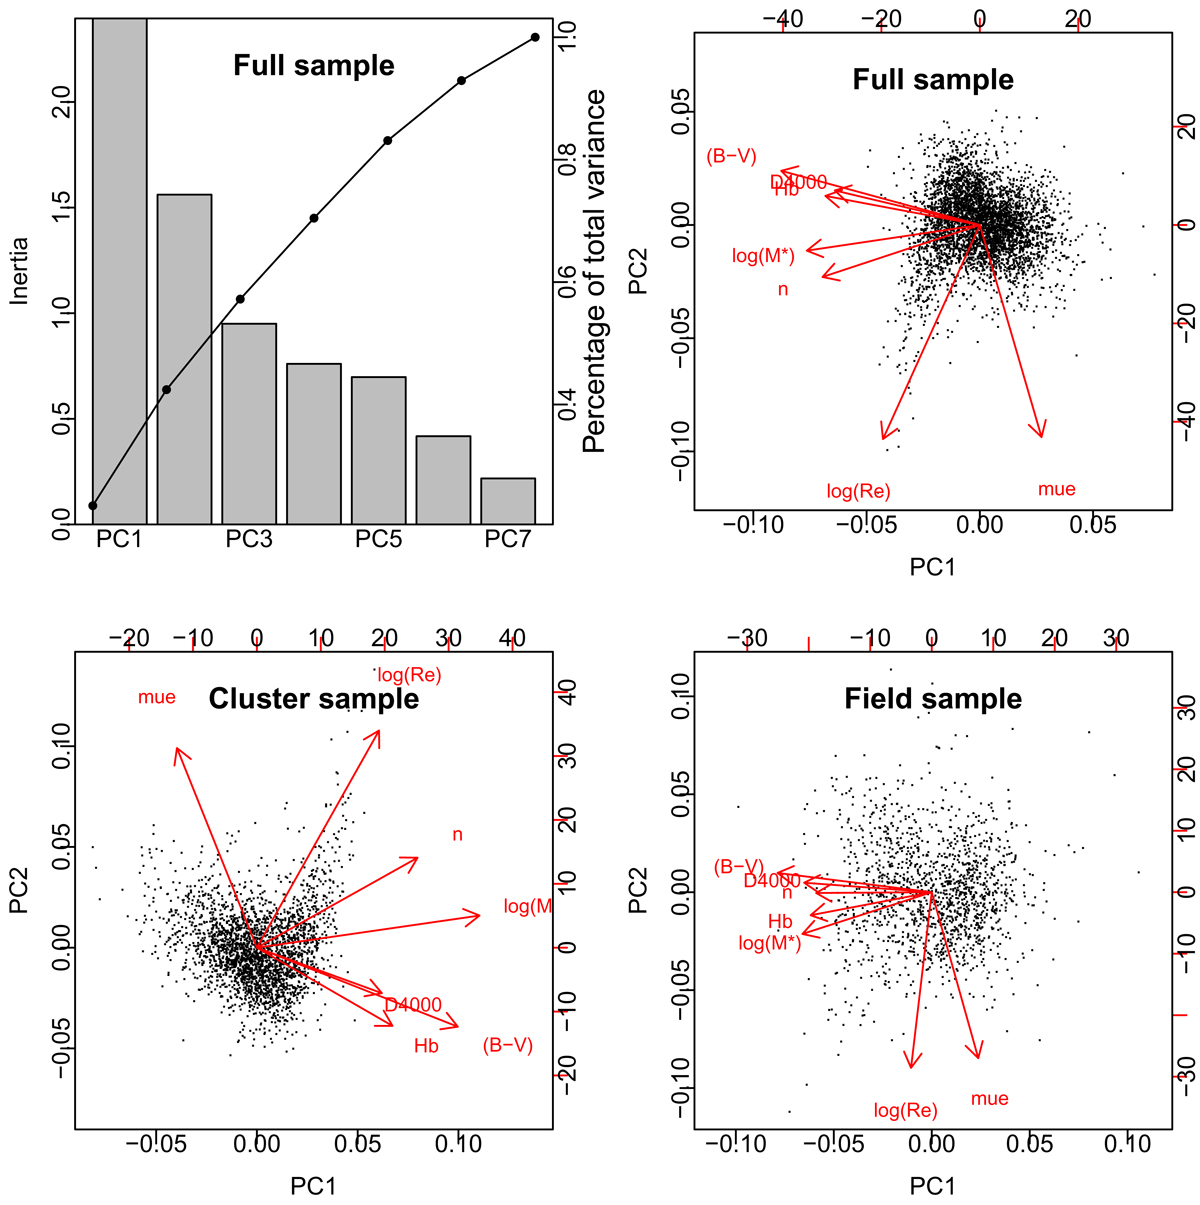
Principal component analysis using the seven parameters used for the clustering and MP analyses (Sect. 5.1). Top left: scree plot for the full sample showing the variance (eigenvalues) of the seven principal components (PCs). The curve represents the cumulative percentage of the total variance. The scree plots for the cluster and field sample are very similar. Top right: projection of the data on the plane of the first two PCs with arrows showing the loadings and direction of the parameters. The same diagram is plotted for the cluster (bottom left) and field (bottom right) samples.
Current usage metrics show cumulative count of Article Views (full-text article views including HTML views, PDF and ePub downloads, according to the available data) and Abstracts Views on Vision4Press platform.
Data correspond to usage on the plateform after 2015. The current usage metrics is available 48-96 hours after online publication and is updated daily on week days.
Initial download of the metrics may take a while.