Fig. 3.
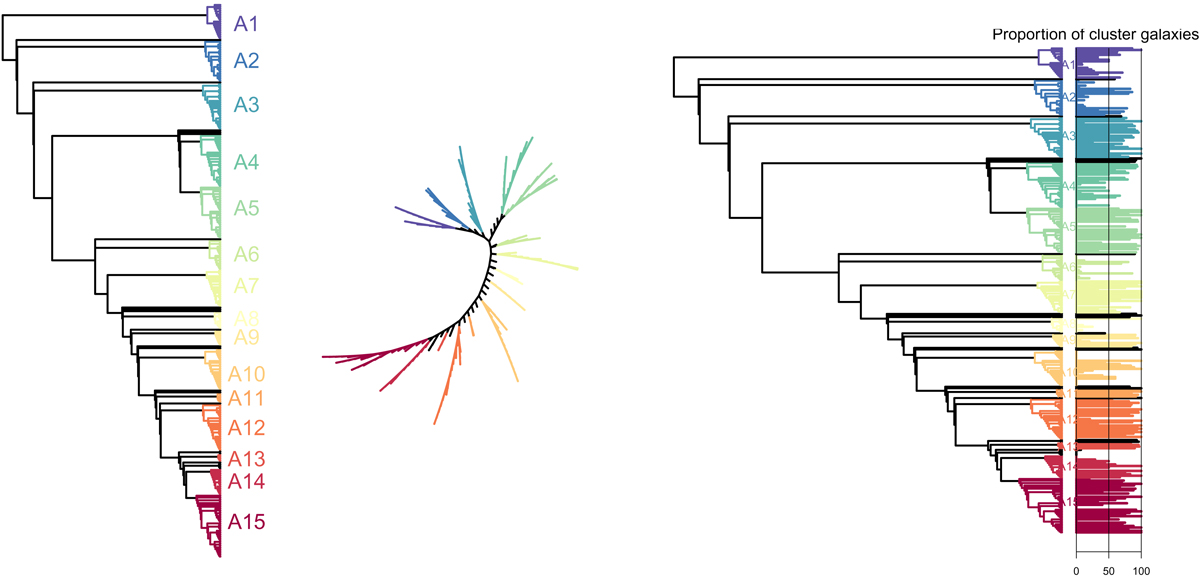
Three possible views of the phylogenetic tree for the full sample of galaxies. Left: tree with the group definition. Only groups with more than 50 galaxies are considered for this tree in this paper. The tree has been rooted with the group (at the top) with low values of B − V, nV and log(M*). Middle: unrooted tree. Right: tree with the proportion of cluster galaxies within each of the 300 pre-clusters indicated by the length of segments.
Current usage metrics show cumulative count of Article Views (full-text article views including HTML views, PDF and ePub downloads, according to the available data) and Abstracts Views on Vision4Press platform.
Data correspond to usage on the plateform after 2015. The current usage metrics is available 48-96 hours after online publication and is updated daily on week days.
Initial download of the metrics may take a while.