Fig. A.2.
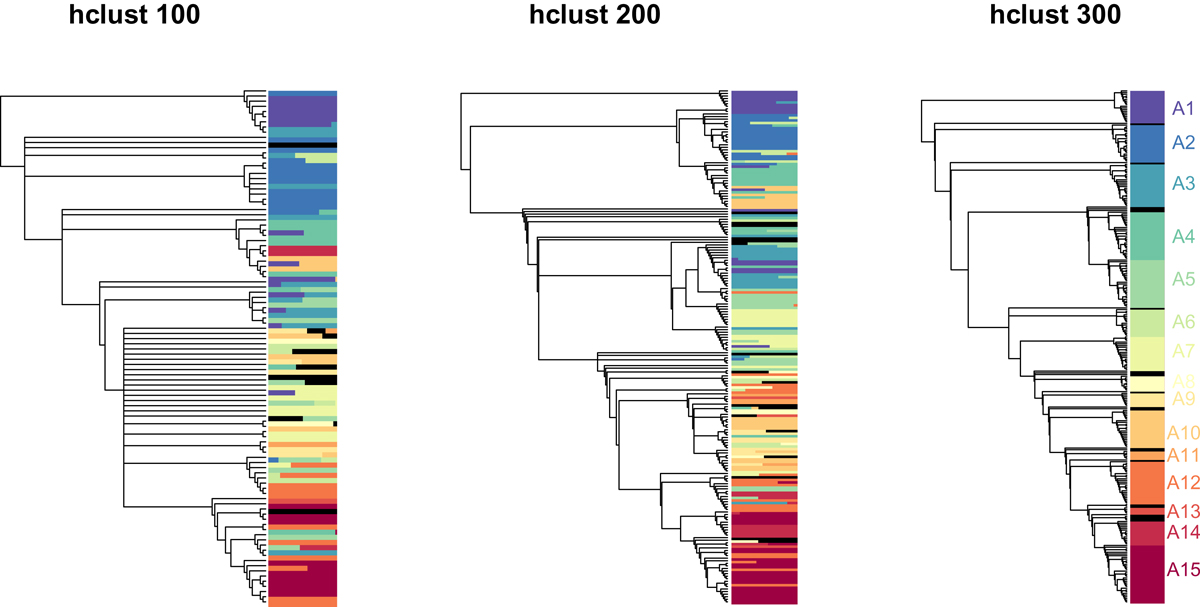
Trees obtained for the full sample with 100 (left), 200 (middle), and 300 (right) pre-clusters (see Sect. 3.2). The tree on the right is the one shown in Fig. 3. The coloured bars at each tip of the trees give the distribution of the galaxies of the corresponding pre-cluster in the groups defined in this paper (the classes A).
Current usage metrics show cumulative count of Article Views (full-text article views including HTML views, PDF and ePub downloads, according to the available data) and Abstracts Views on Vision4Press platform.
Data correspond to usage on the plateform after 2015. The current usage metrics is available 48-96 hours after online publication and is updated daily on week days.
Initial download of the metrics may take a while.