Fig. 2.
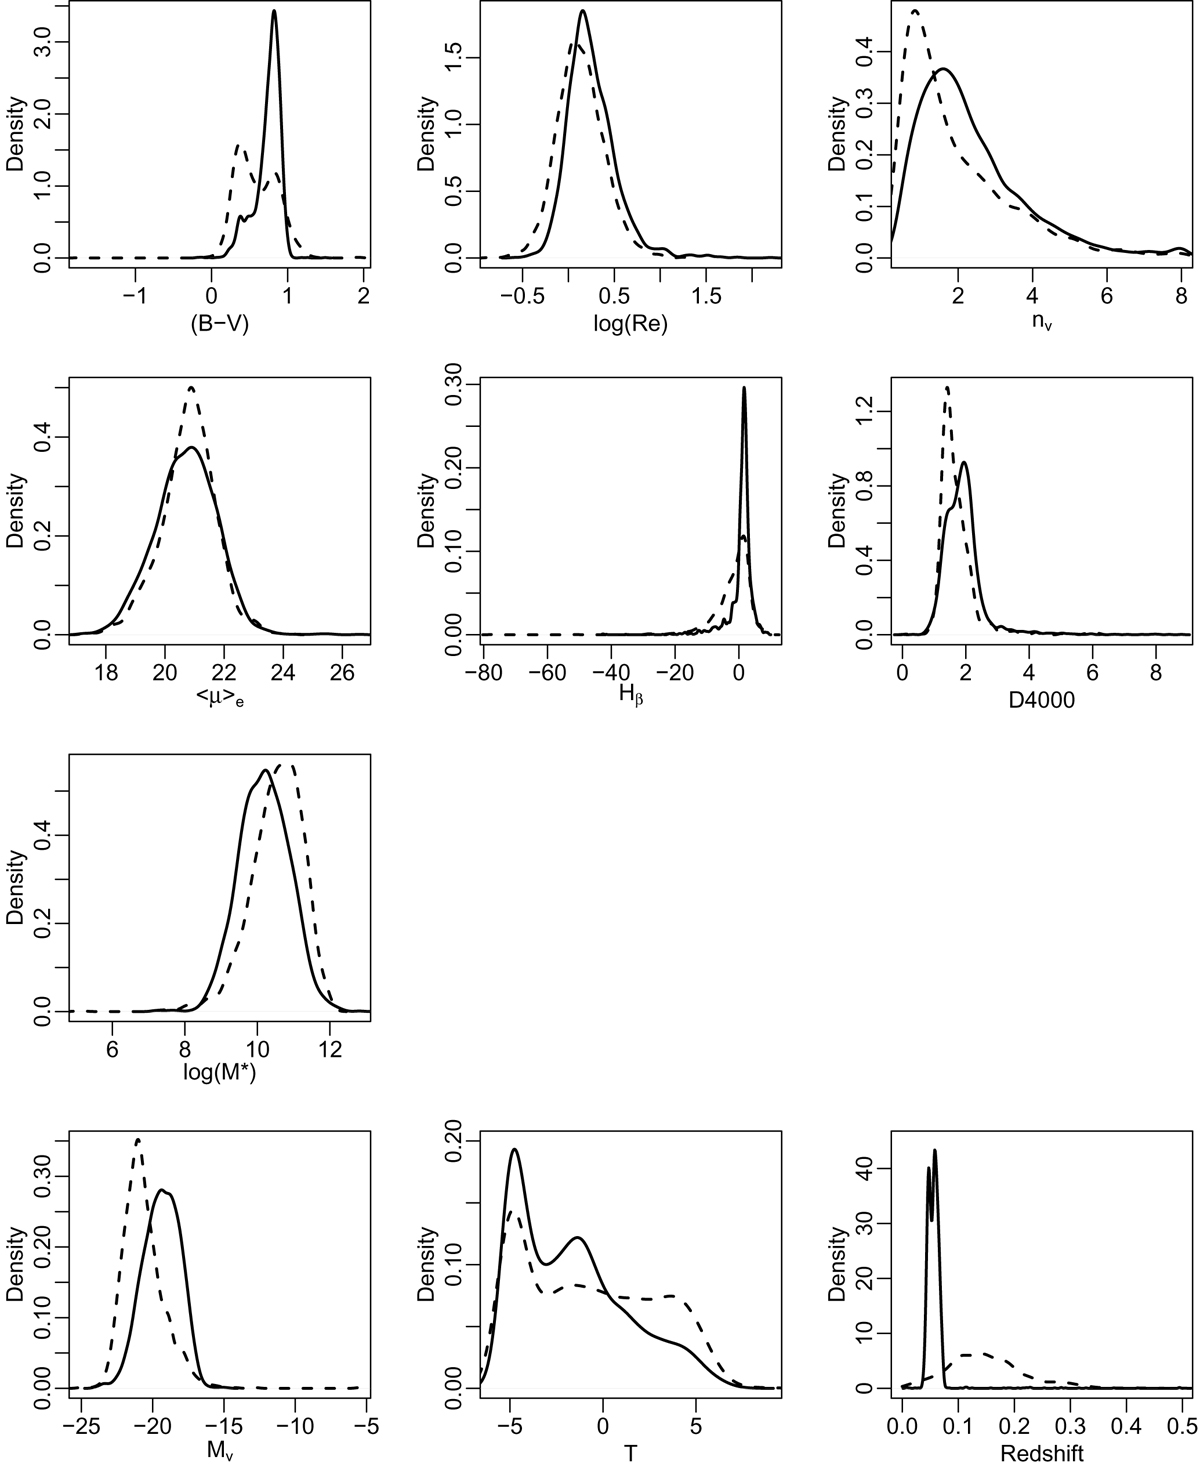
Gaussian kernel density distribution of the seven variables used in the clustering and maximum parsimony computation (Table 1), plus the absolute V magnitude, the morphology T and the redshift, for the cluster (solid line) and field (dotted line) samples. The scale on the y-axis is given by the integral of the kernel density estimation, which is normalised to one.
Current usage metrics show cumulative count of Article Views (full-text article views including HTML views, PDF and ePub downloads, according to the available data) and Abstracts Views on Vision4Press platform.
Data correspond to usage on the plateform after 2015. The current usage metrics is available 48-96 hours after online publication and is updated daily on week days.
Initial download of the metrics may take a while.