Open Access
Fig. 16.
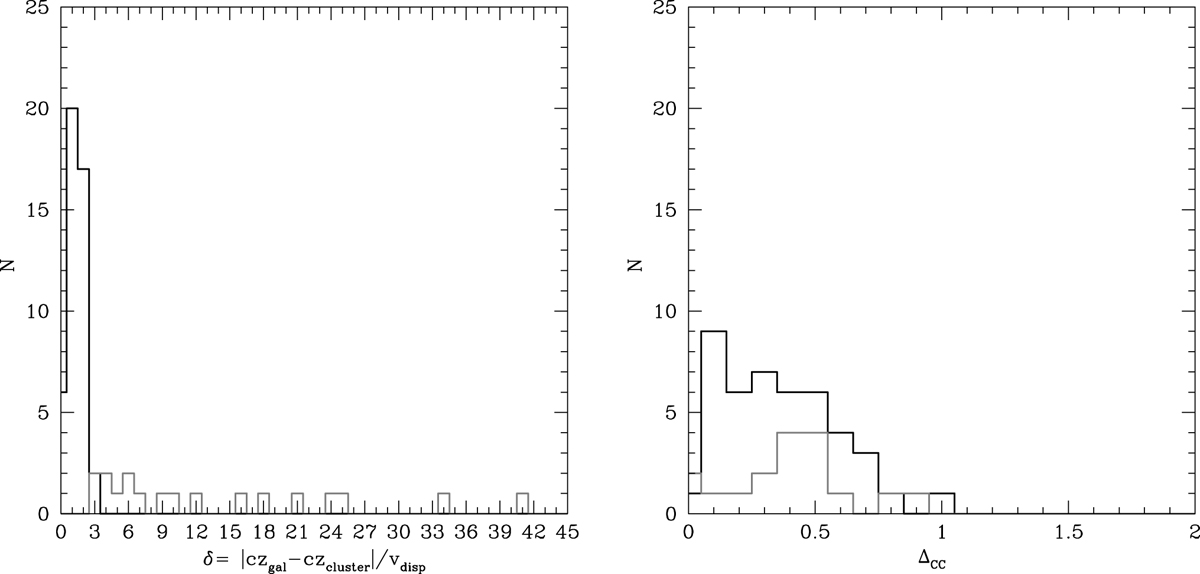
Histograms for jellyfish galaxies that are in our cluster (black lines) or field (grey lines) samples, for the parameter δ (see text) and the distance ΔCC to cluster centre.
Current usage metrics show cumulative count of Article Views (full-text article views including HTML views, PDF and ePub downloads, according to the available data) and Abstracts Views on Vision4Press platform.
Data correspond to usage on the plateform after 2015. The current usage metrics is available 48-96 hours after online publication and is updated daily on week days.
Initial download of the metrics may take a while.