Free Access
Fig. 9.
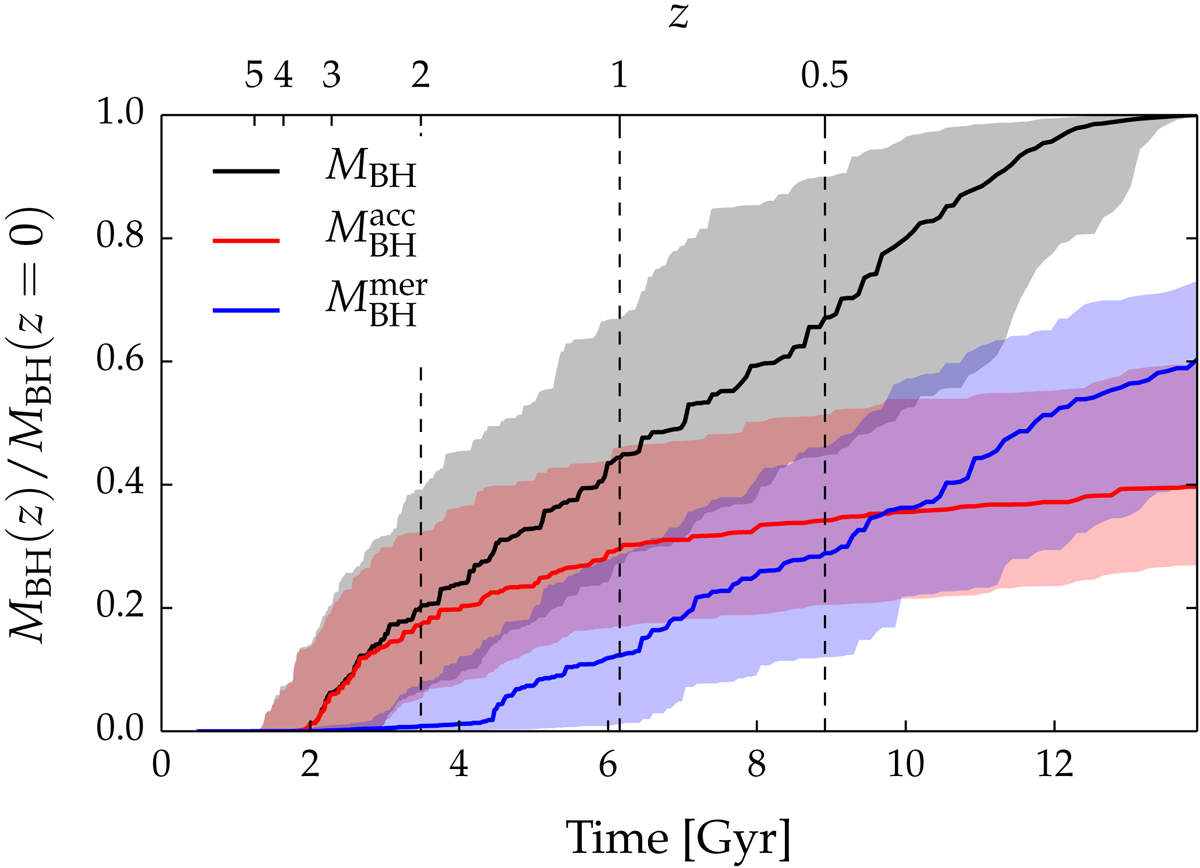
Evolution of SMBH mass divided into two growth channels (gas accretion in red and BH-BH mergers in blue) considering the complete sample. In black we also plotted the total SMBH mass. Solid lines represent median values of our sample and shadowed regions represent 16 and 84 percentiles.
Current usage metrics show cumulative count of Article Views (full-text article views including HTML views, PDF and ePub downloads, according to the available data) and Abstracts Views on Vision4Press platform.
Data correspond to usage on the plateform after 2015. The current usage metrics is available 48-96 hours after online publication and is updated daily on week days.
Initial download of the metrics may take a while.