Free Access
Fig. 7.
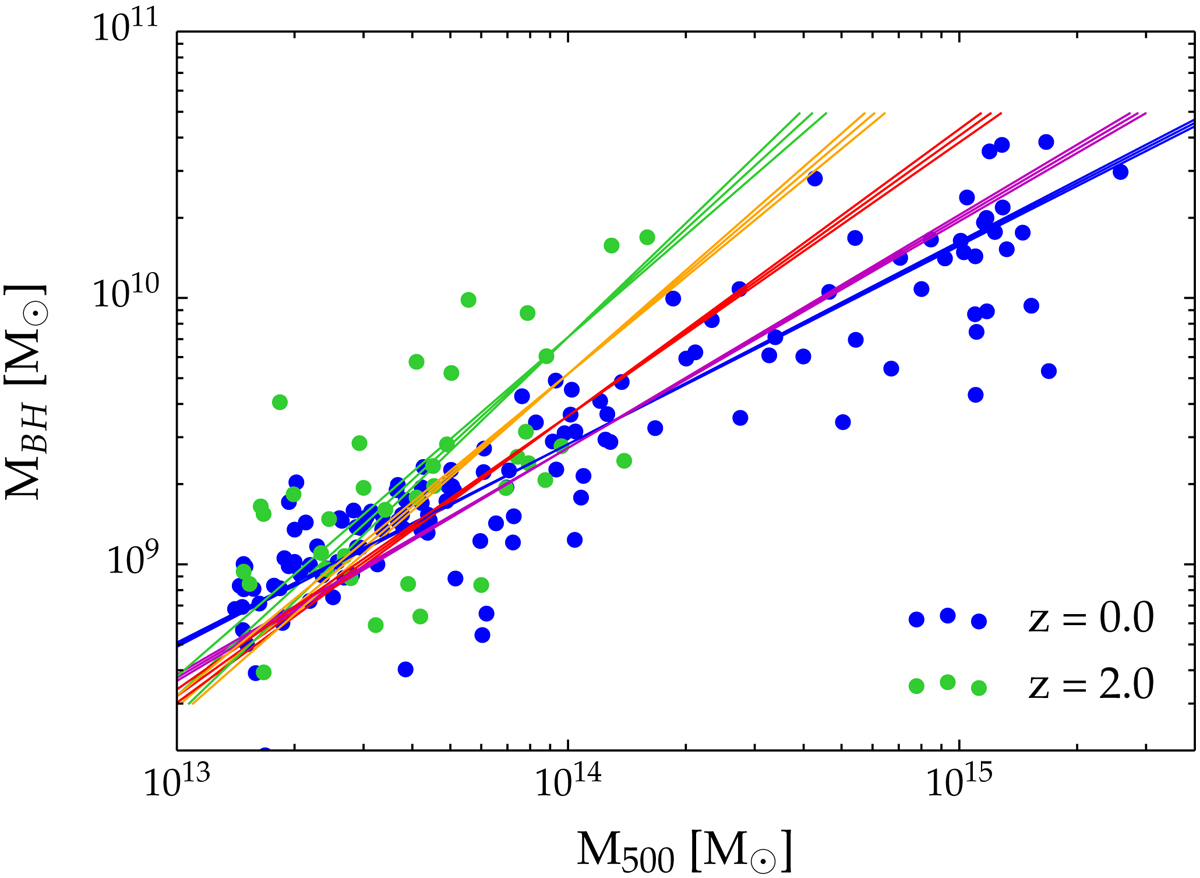
Correlation between MBH and M500 at different redshifts. At every redshift we show the best-fitting relation in the mass range of the respective samples. Namely, we show in green, orange, red, magenta, and blue the mass sample related to z = 2, 1.5, 1, 0.5 and z = 0, respectively.
Current usage metrics show cumulative count of Article Views (full-text article views including HTML views, PDF and ePub downloads, according to the available data) and Abstracts Views on Vision4Press platform.
Data correspond to usage on the plateform after 2015. The current usage metrics is available 48-96 hours after online publication and is updated daily on week days.
Initial download of the metrics may take a while.