Free Access
Fig. 5.
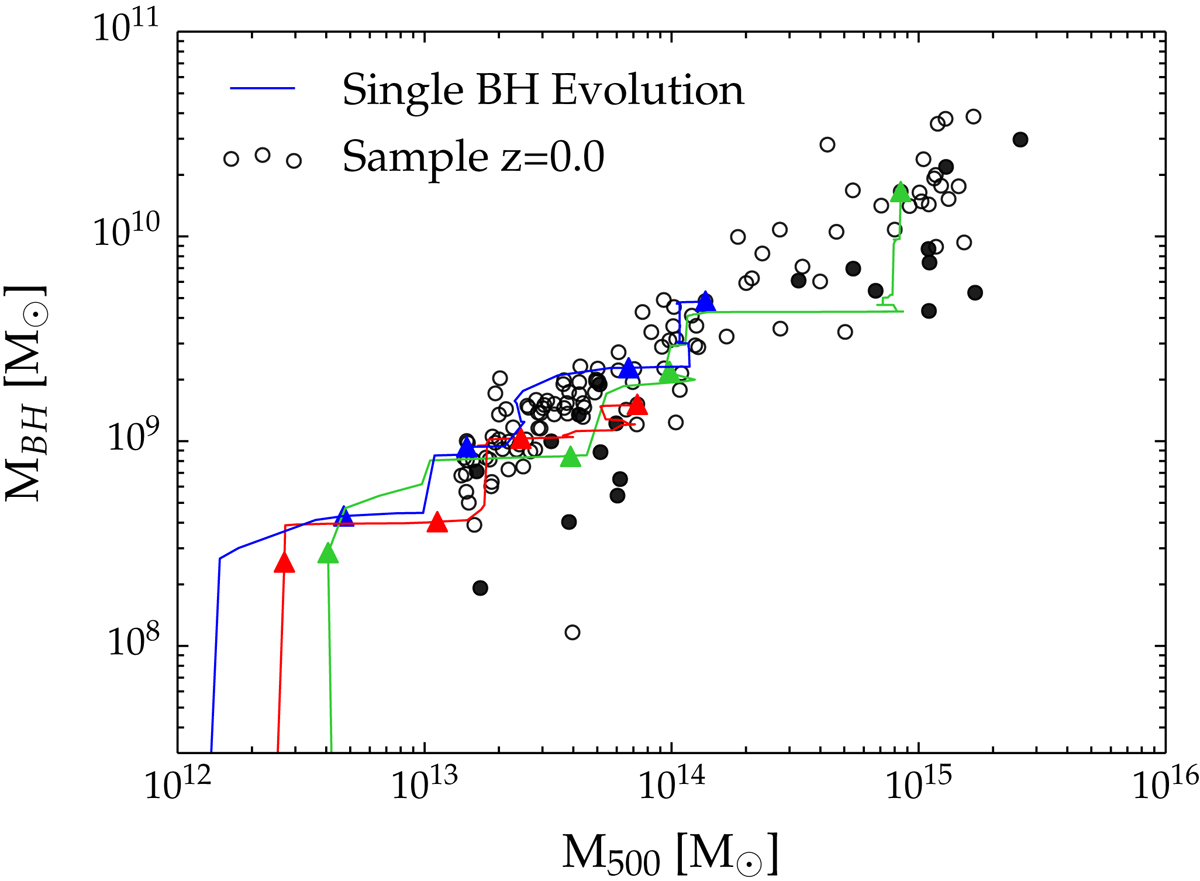
Evolutionary tracks of three different systems on the MBH–M500 plane. Triangles over each line indicate the position of the systems on the plane at z = 3, z = 2, z = 1 and z = 0. Black circles represent our numerical sample at z = 0; the filled ones are systems for which M500 is increased by more than 40% in the last Gyr.
Current usage metrics show cumulative count of Article Views (full-text article views including HTML views, PDF and ePub downloads, according to the available data) and Abstracts Views on Vision4Press platform.
Data correspond to usage on the plateform after 2015. The current usage metrics is available 48-96 hours after online publication and is updated daily on week days.
Initial download of the metrics may take a while.