Fig. 2.
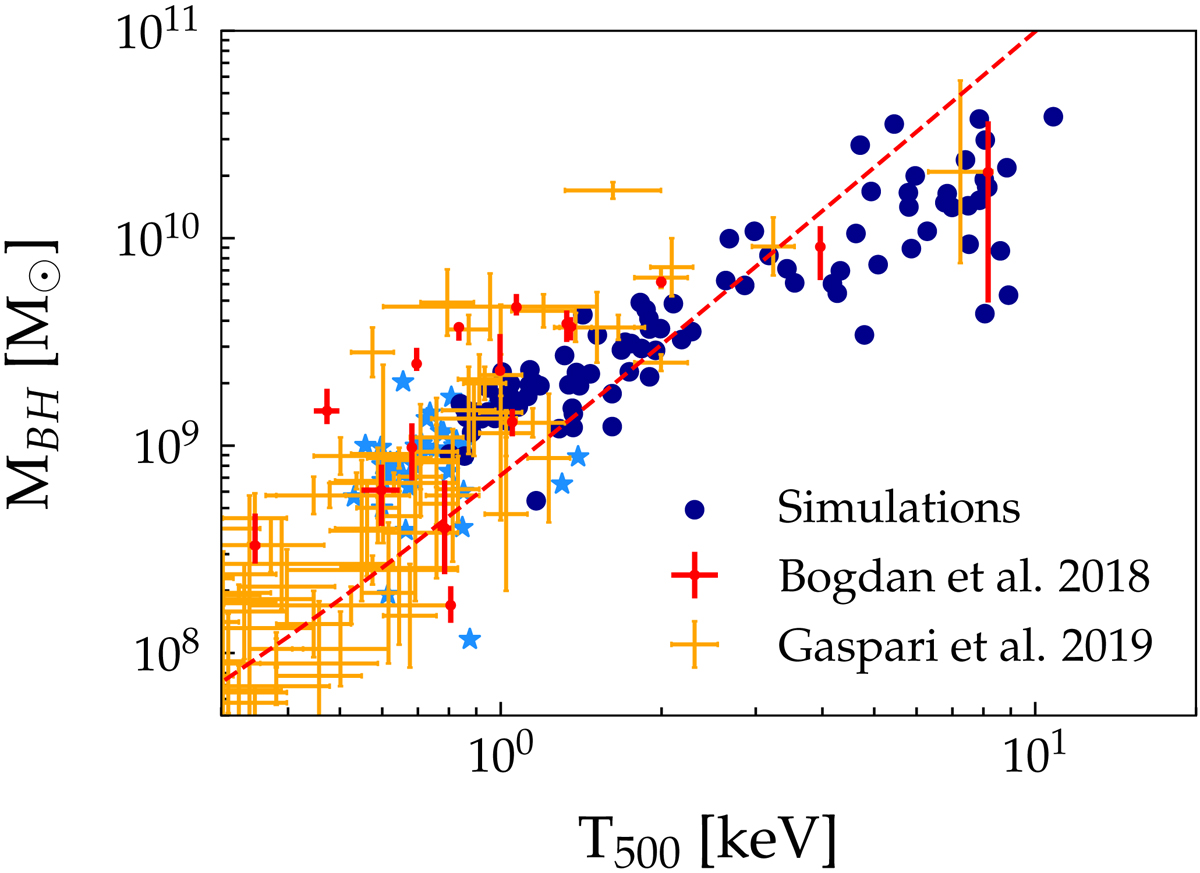
Correlation between SMBH mass, MBH, and the clusters temperature, T500. Red and orange crosses refer to observational data from Bogdán et al. (2018) and Gaspari et al. (2019) respectively. Dark-blue dots represent simulated clusters in the temperature subsample while cyan stars show the remaining objects of the mass sample. Dashed red line is the prediction of the toy model by Churazov et al. (2005).
Current usage metrics show cumulative count of Article Views (full-text article views including HTML views, PDF and ePub downloads, according to the available data) and Abstracts Views on Vision4Press platform.
Data correspond to usage on the plateform after 2015. The current usage metrics is available 48-96 hours after online publication and is updated daily on week days.
Initial download of the metrics may take a while.