Fig. 13.
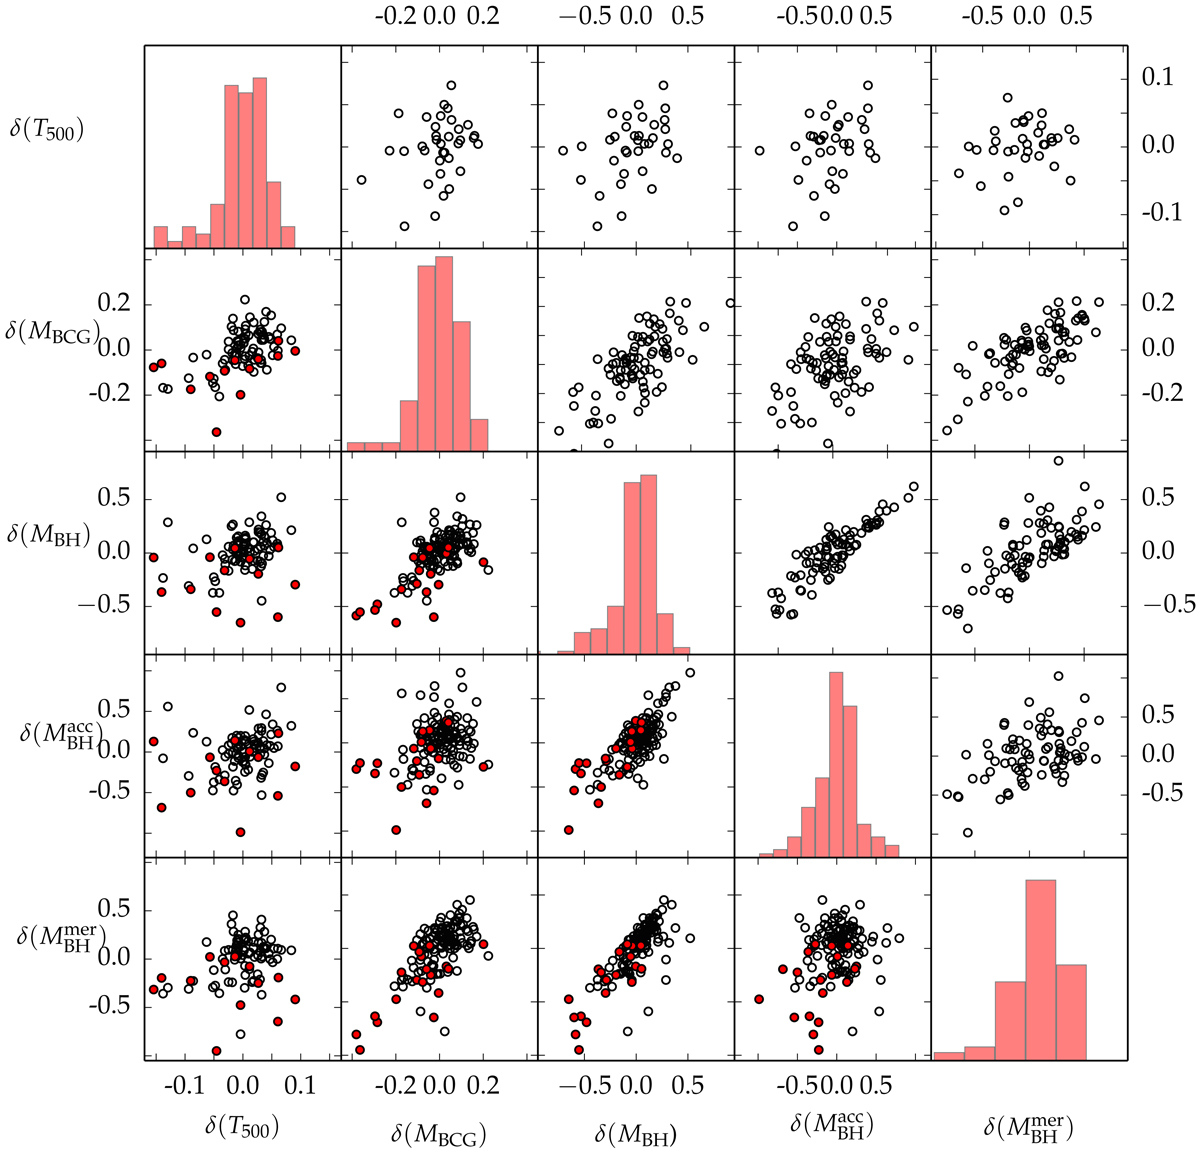
Covariance matrix. Each axis represents the logarithmic difference between the actual value of a quantity X and the expected value from the linear relation (X-M500) at its fixed mass, as defined by Eq. (5). Panels above the diagonal refer to z = 1 while panels below the diagonal refer to z = 0. The diagonal panels show the distribution of δ(X) at z = 0. Red points define clusters which have experienced a mass growth of at least 40% during the last Gyr.
Current usage metrics show cumulative count of Article Views (full-text article views including HTML views, PDF and ePub downloads, according to the available data) and Abstracts Views on Vision4Press platform.
Data correspond to usage on the plateform after 2015. The current usage metrics is available 48-96 hours after online publication and is updated daily on week days.
Initial download of the metrics may take a while.