Fig. 12.
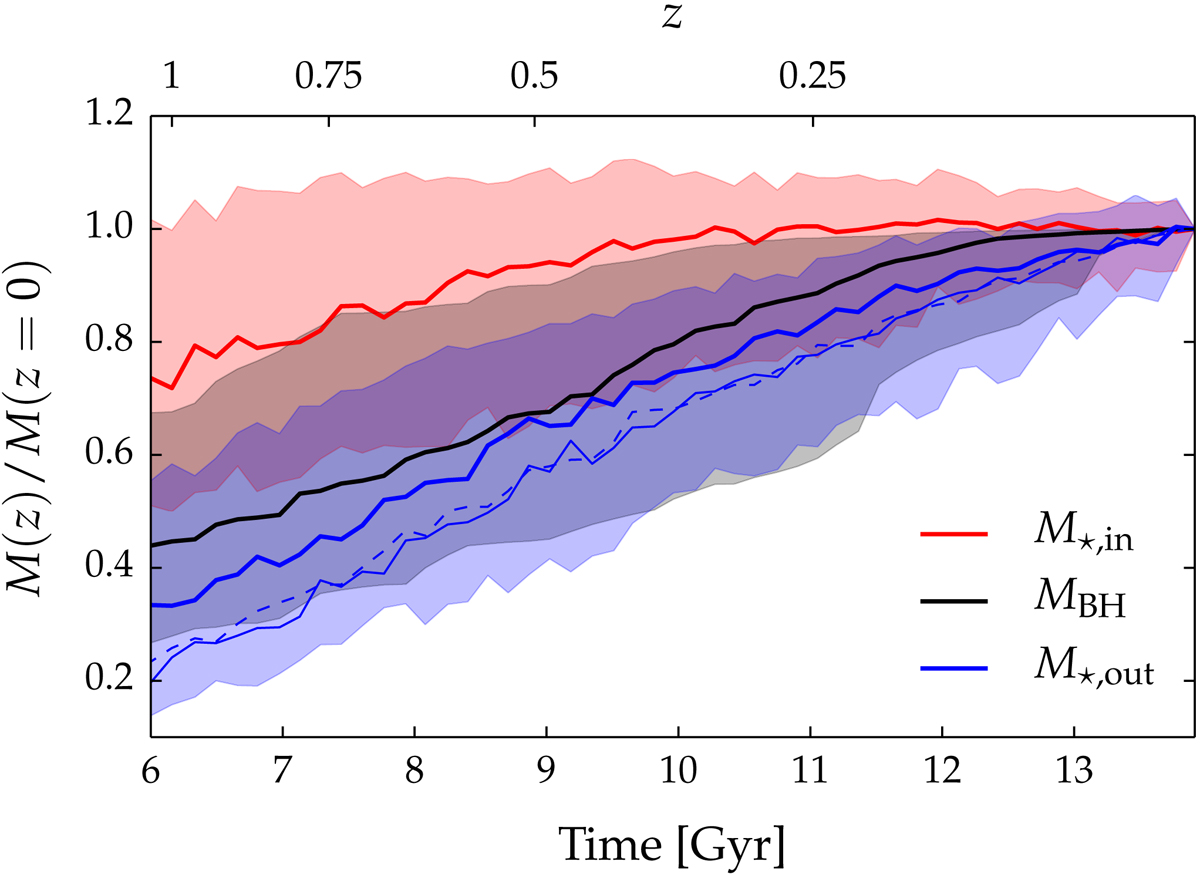
Evolution of M⋆,in, defined as the stellar mass inside a spherical region of radius 30 kpc, SMBH mass, and M⋆,out, defined as the total mass of the stars enclosed in a spherical shell with radii 30 kpc and 100 kpc. All the quantities are normalized to their respective values at z = 0. Solid lines represent median values and shadowed regions represent 16 and 84 percentiles. The three different blue lines represent three definition of M⋆,out. In particular the thin blue solid line is the stellar mass in a spherical shell with radii 100 kpc and 200 kpc while the dashed blue line is the stellar mass in a spherical shell with radii 50 kpc and 350 kpc.
Current usage metrics show cumulative count of Article Views (full-text article views including HTML views, PDF and ePub downloads, according to the available data) and Abstracts Views on Vision4Press platform.
Data correspond to usage on the plateform after 2015. The current usage metrics is available 48-96 hours after online publication and is updated daily on week days.
Initial download of the metrics may take a while.