Fig. 1.
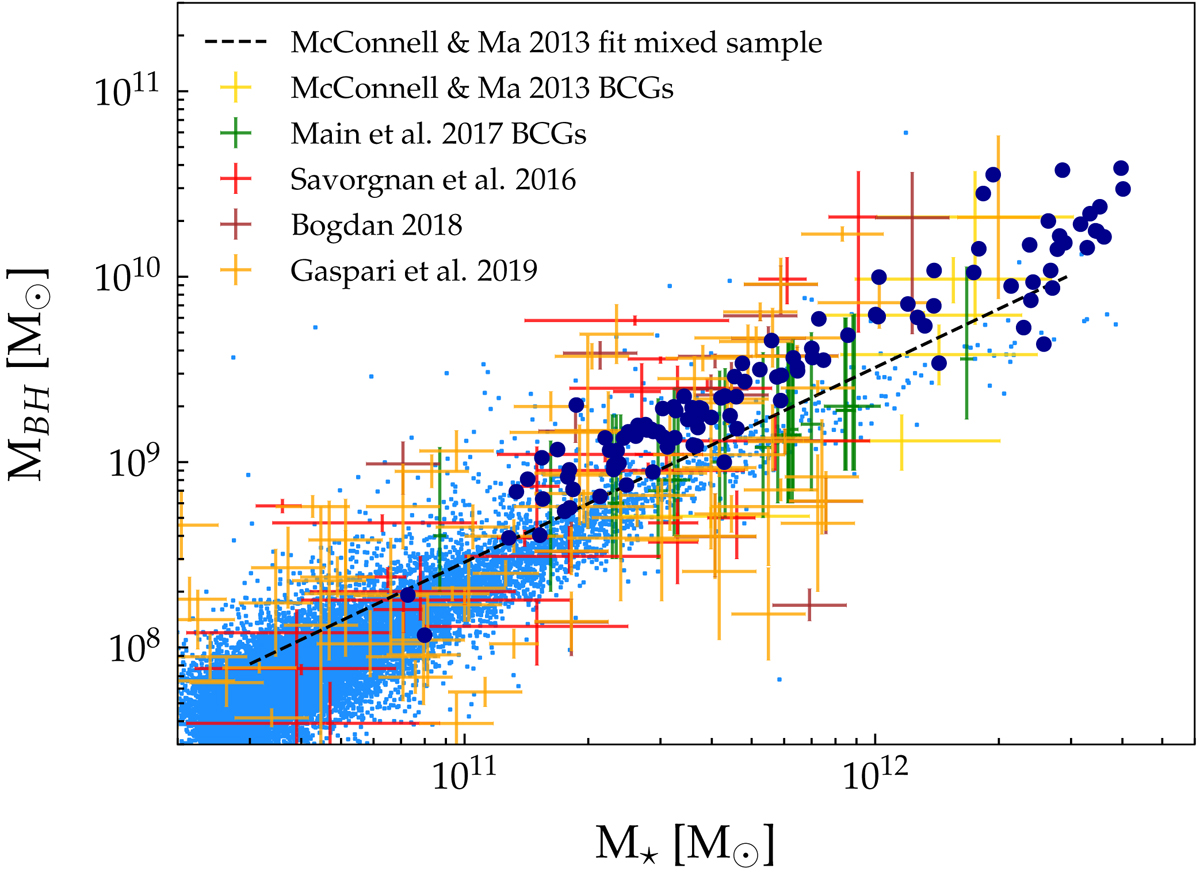
Correlation between stellar mass and SMBH mass in observations and simulations. Small light-blue points represent non-BCG simulated galaxies, large black dots represent simulated BCGs. Yellow, green, red, brown, and orange crosses represent the observational data with their error bars taken from McConnell & Ma (2013), Main et al. (2017), Savorgnan et al. (2016), Bogdán et al. (2018), and Gaspari et al. (2019) respectively. The dashed black line is a linear best-fit of the sample of different type of galaxies by McConnell & Ma (2013). See text for details about MBH and M⋆ definition and measurement.
Current usage metrics show cumulative count of Article Views (full-text article views including HTML views, PDF and ePub downloads, according to the available data) and Abstracts Views on Vision4Press platform.
Data correspond to usage on the plateform after 2015. The current usage metrics is available 48-96 hours after online publication and is updated daily on week days.
Initial download of the metrics may take a while.