Fig. 9
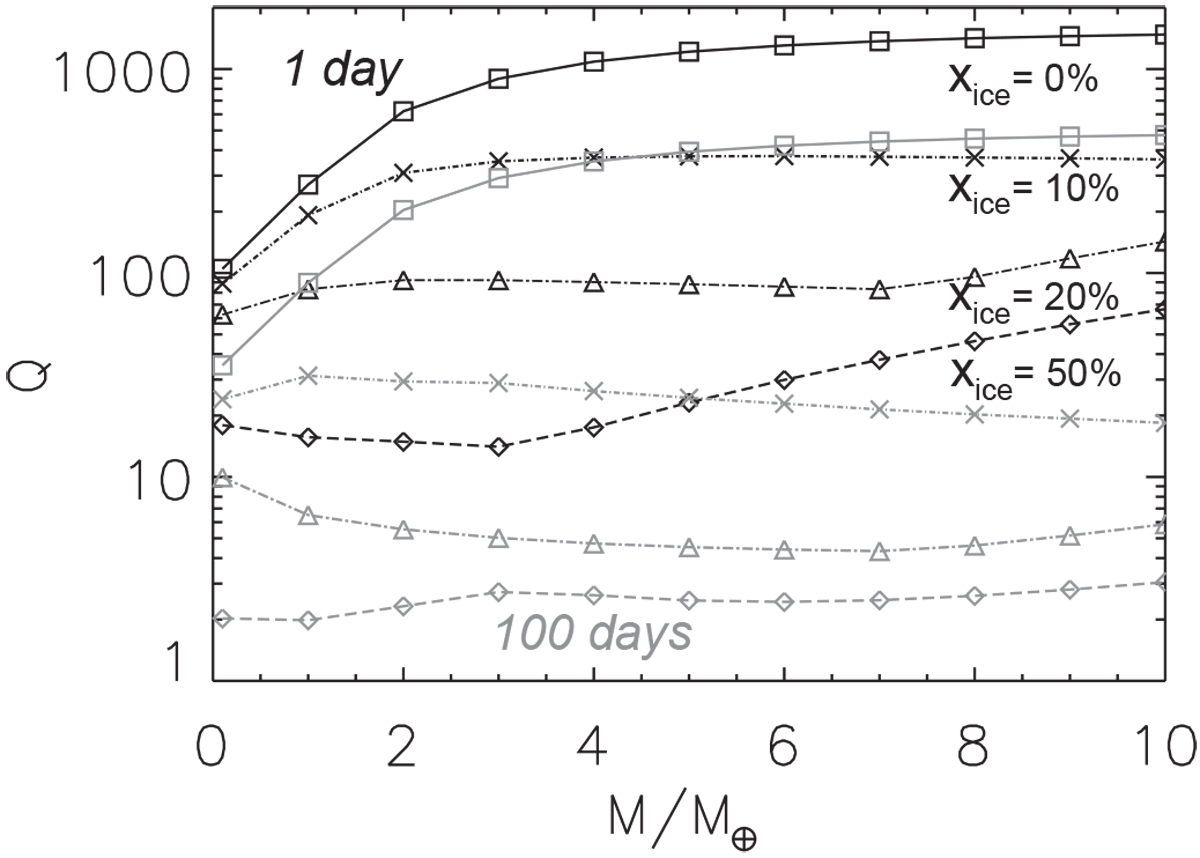
Computed Q factor for ice-rich planets with masses ranging between 0.1 and 10 Earth masses for two tidal periods (1 day in black and 100 days in gray) and three values of ice fraction (10% – cross, 20% – triangle, and 50% – diamond) for a HP ice viscosity of 1018 Pa s and thereference viscosity profile for the rocky part (see Sect. 2). Curve symbols are similar to those in Fig. 2.
Current usage metrics show cumulative count of Article Views (full-text article views including HTML views, PDF and ePub downloads, according to the available data) and Abstracts Views on Vision4Press platform.
Data correspond to usage on the plateform after 2015. The current usage metrics is available 48-96 hours after online publication and is updated daily on week days.
Initial download of the metrics may take a while.