Fig. 6
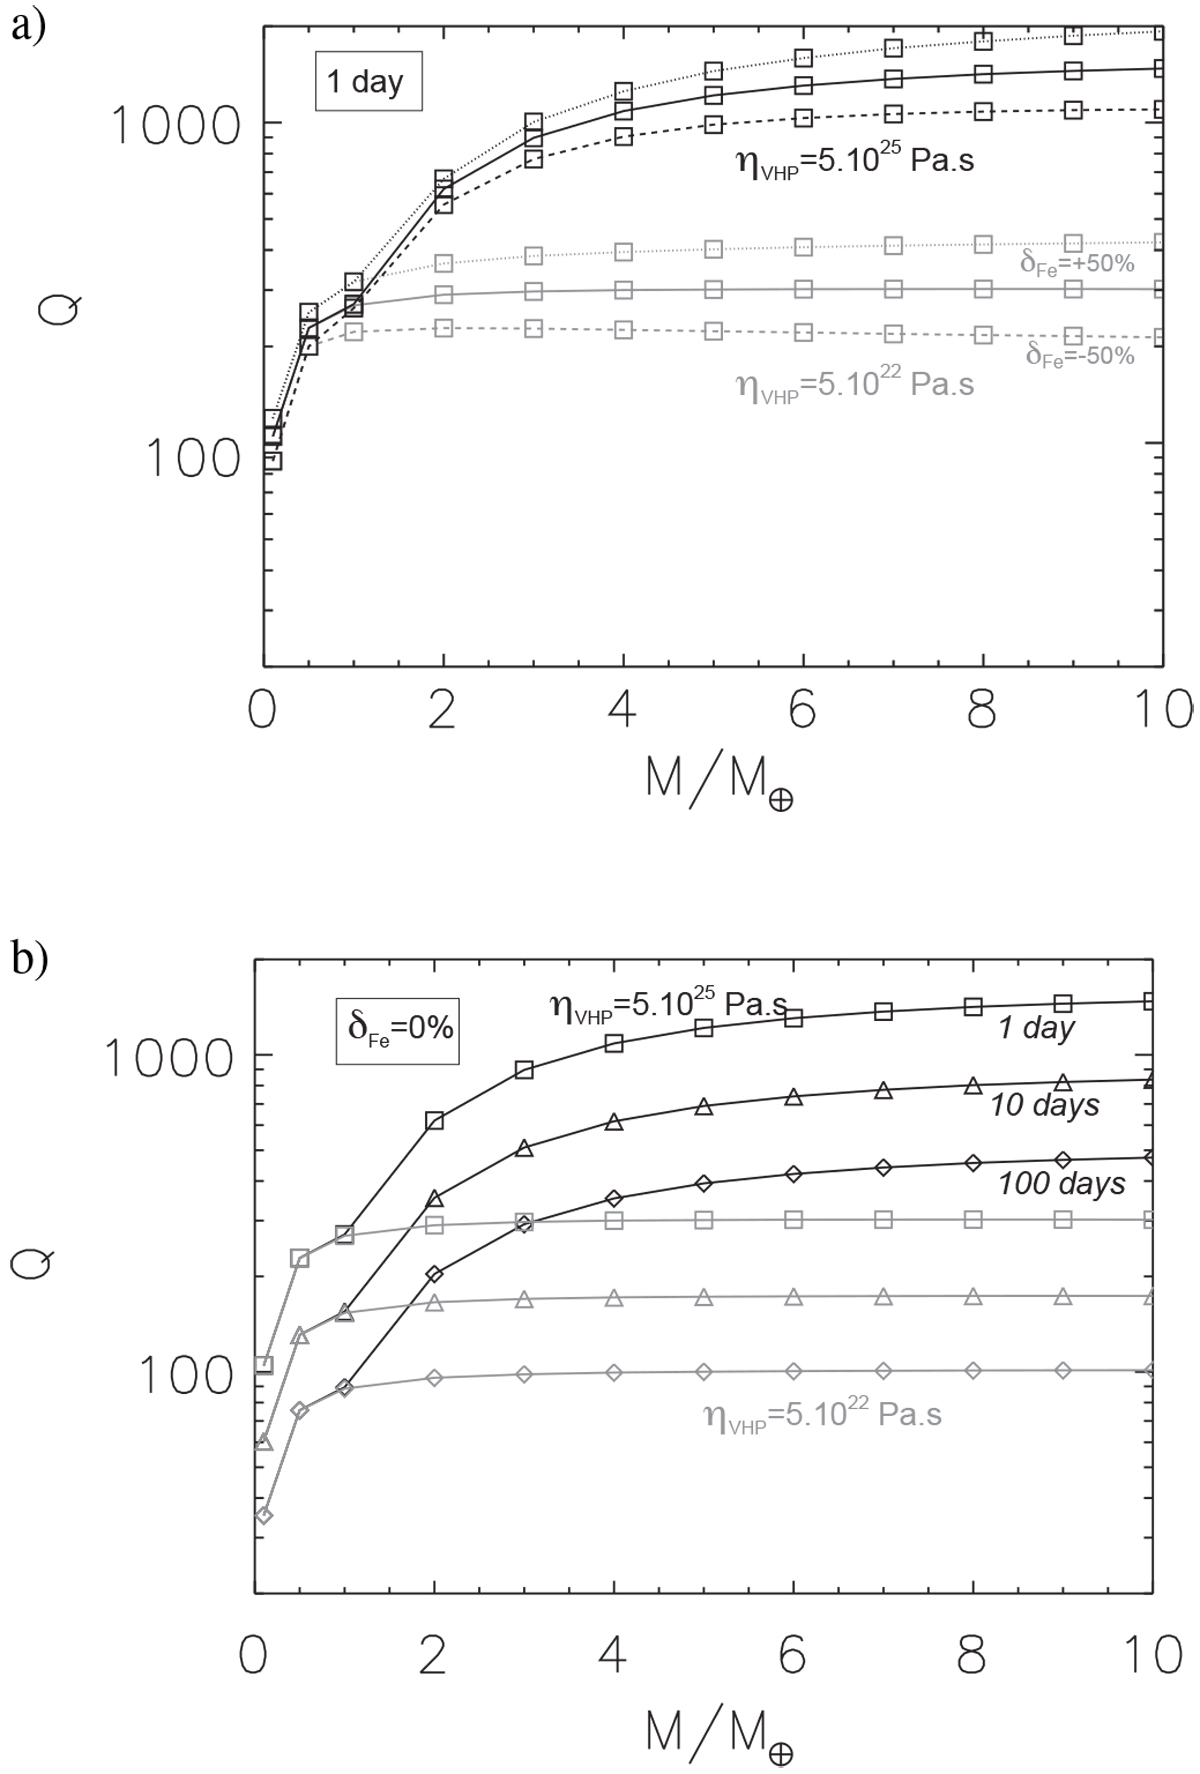
Computed Q factor for rocky planets with mass ranging between 0.1 and 10 Earth masses (a) for a tidal period of 1 day and three iron content values varying between −50 and +50% relative to the reference value, and (b) for the iron content of the Earth and three tidal periods of 1 (square), 10 (triangle) and 100 (diamond) days. Two extreme values are considered for the very-high-pressure rock viscosity (ηVHP): 5 × 10²² Pa s (gray) assuming no viscosity increase relative to the reference Earth lower mantle and 5.1025 Pa.s (black) assuming a factor 1000 increase relative to the reference, i.e. the lower mantle of the Earth. Curve symbols are the same as in Fig. 2.
Current usage metrics show cumulative count of Article Views (full-text article views including HTML views, PDF and ePub downloads, according to the available data) and Abstracts Views on Vision4Press platform.
Data correspond to usage on the plateform after 2015. The current usage metrics is available 48-96 hours after online publication and is updated daily on week days.
Initial download of the metrics may take a while.