Fig. 10
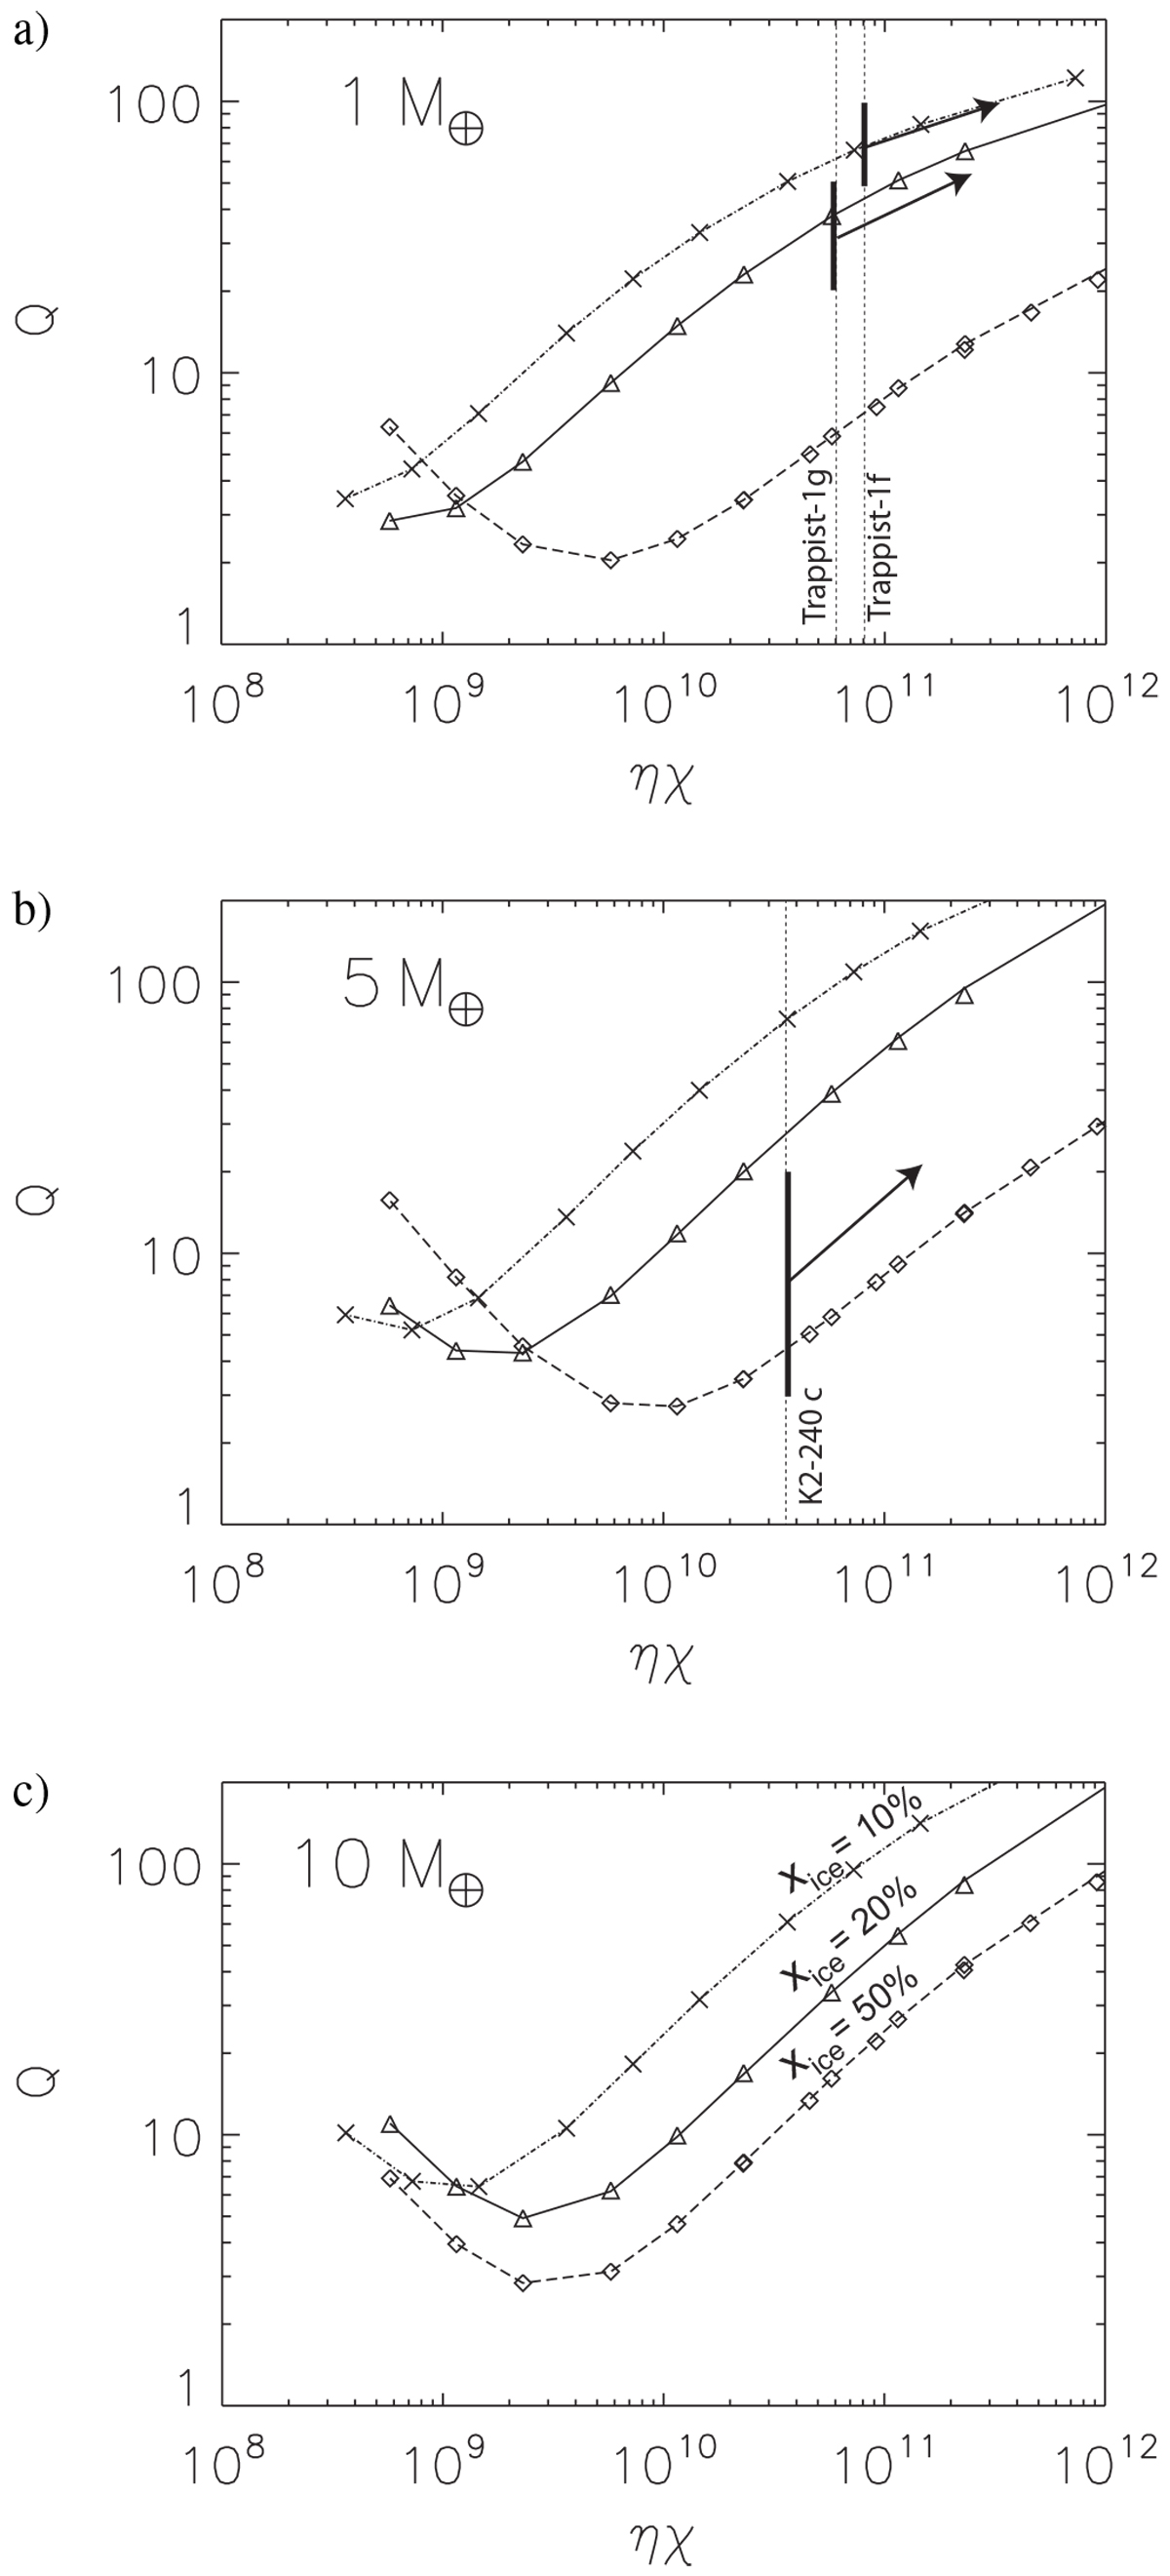
Computed Q factor for ice-rich planets with masses of 1 (a), 5 (b), and 10 (c) M⊕, and three icecontents (10, 20, and 50%), as a function of viscosity η and tidal frequency χ for theice mantle. The vertical thick black segments indicate the expected values of Q for three planet candidates (Trappist-1 f, Trappist-1 g, and K2-240 c) for a high-pressure ice viscosity of 1016 Pa s. The black arrows indicate the trend if larger ice viscosity values are considered.
Current usage metrics show cumulative count of Article Views (full-text article views including HTML views, PDF and ePub downloads, according to the available data) and Abstracts Views on Vision4Press platform.
Data correspond to usage on the plateform after 2015. The current usage metrics is available 48-96 hours after online publication and is updated daily on week days.
Initial download of the metrics may take a while.