Fig. 2
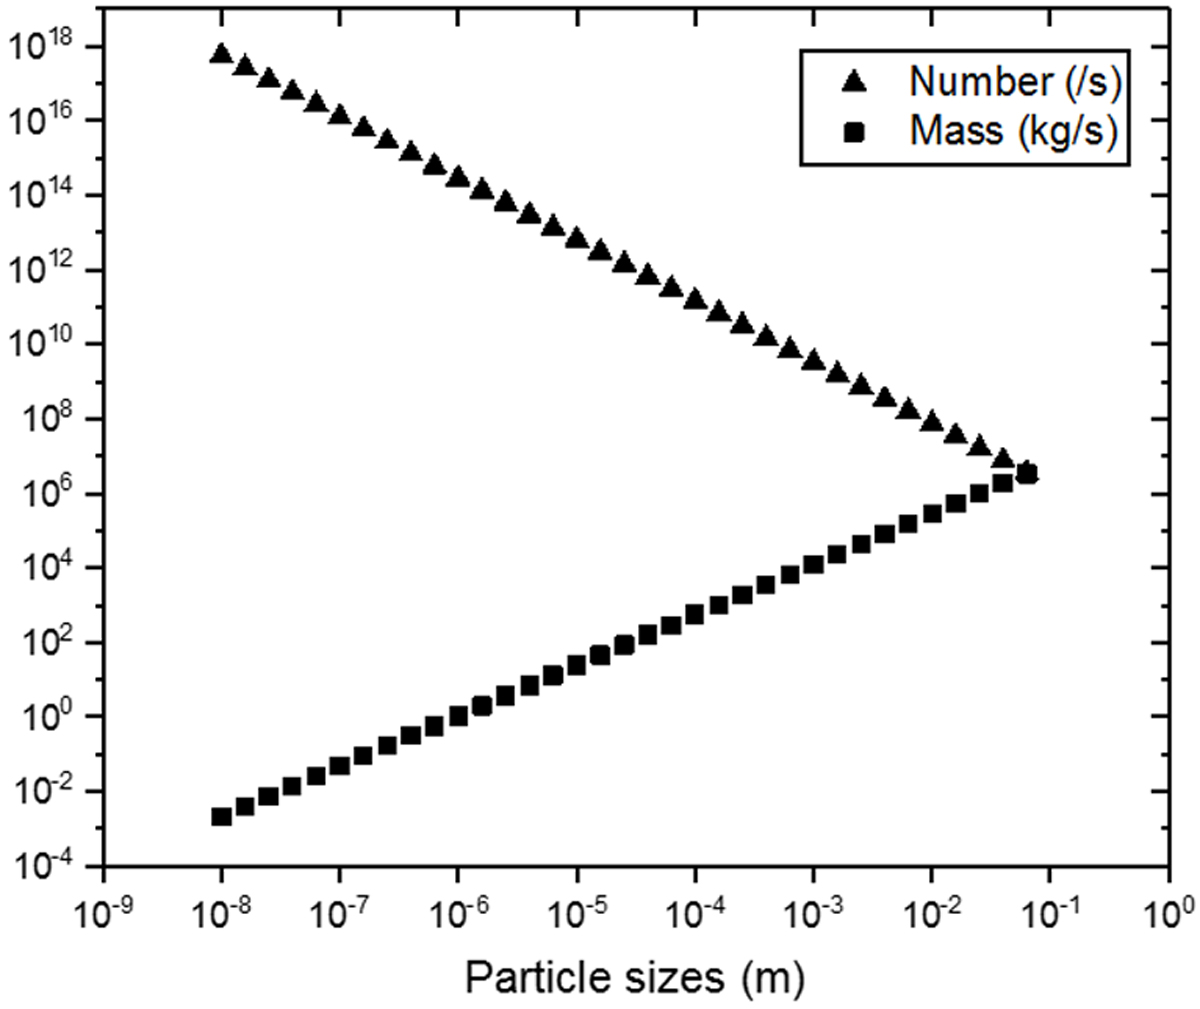
Particle distribution as a function of particle sizes (m). The triangles represent the number of particles produced per seconds, and the circles show the mass particle production per second (kg s−1) from the cometary nucleus of 67P.
Current usage metrics show cumulative count of Article Views (full-text article views including HTML views, PDF and ePub downloads, according to the available data) and Abstracts Views on Vision4Press platform.
Data correspond to usage on the plateform after 2015. The current usage metrics is available 48-96 hours after online publication and is updated daily on week days.
Initial download of the metrics may take a while.