Fig. 7
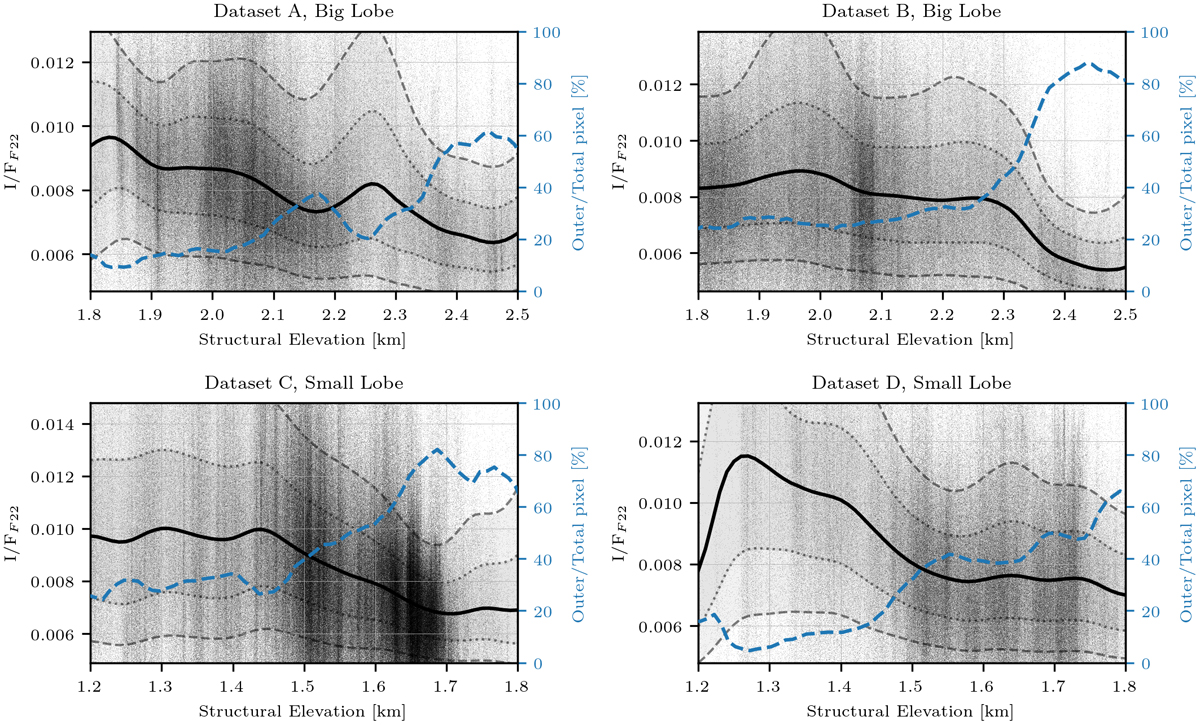
Comparison between dataset results. Image datasets A, B, C, and D correspond to phase angles of 62.90, 62.67, 65.76, and 62.24° respectively. Large-lobe datasets A and B (Ferrari et al. 2018) are plotted in the top row, and small-lobe datasets C and D (thisstudy) are plotted in the bottom row. For each plot, the blue dashed line shows the percentage of pixels that are classified as outer class with respect to the total number of classified pixels. Black dots indicate pixel values of filter 22 (649.2 nm) and the respective positions in the EM. The black solid line represents the running median of I/F values. Dotted lines enclose the 30.0–70.0 percentiles for the reflectance data, and the dashed lines enclose the 15.9–84.1 percentiles. Percentage curves and running medians were computed by binning the data (0.05 km bins) and then computing corresponding descriptive statistics for each bin.
Current usage metrics show cumulative count of Article Views (full-text article views including HTML views, PDF and ePub downloads, according to the available data) and Abstracts Views on Vision4Press platform.
Data correspond to usage on the plateform after 2015. The current usage metrics is available 48-96 hours after online publication and is updated daily on week days.
Initial download of the metrics may take a while.