Fig. 4
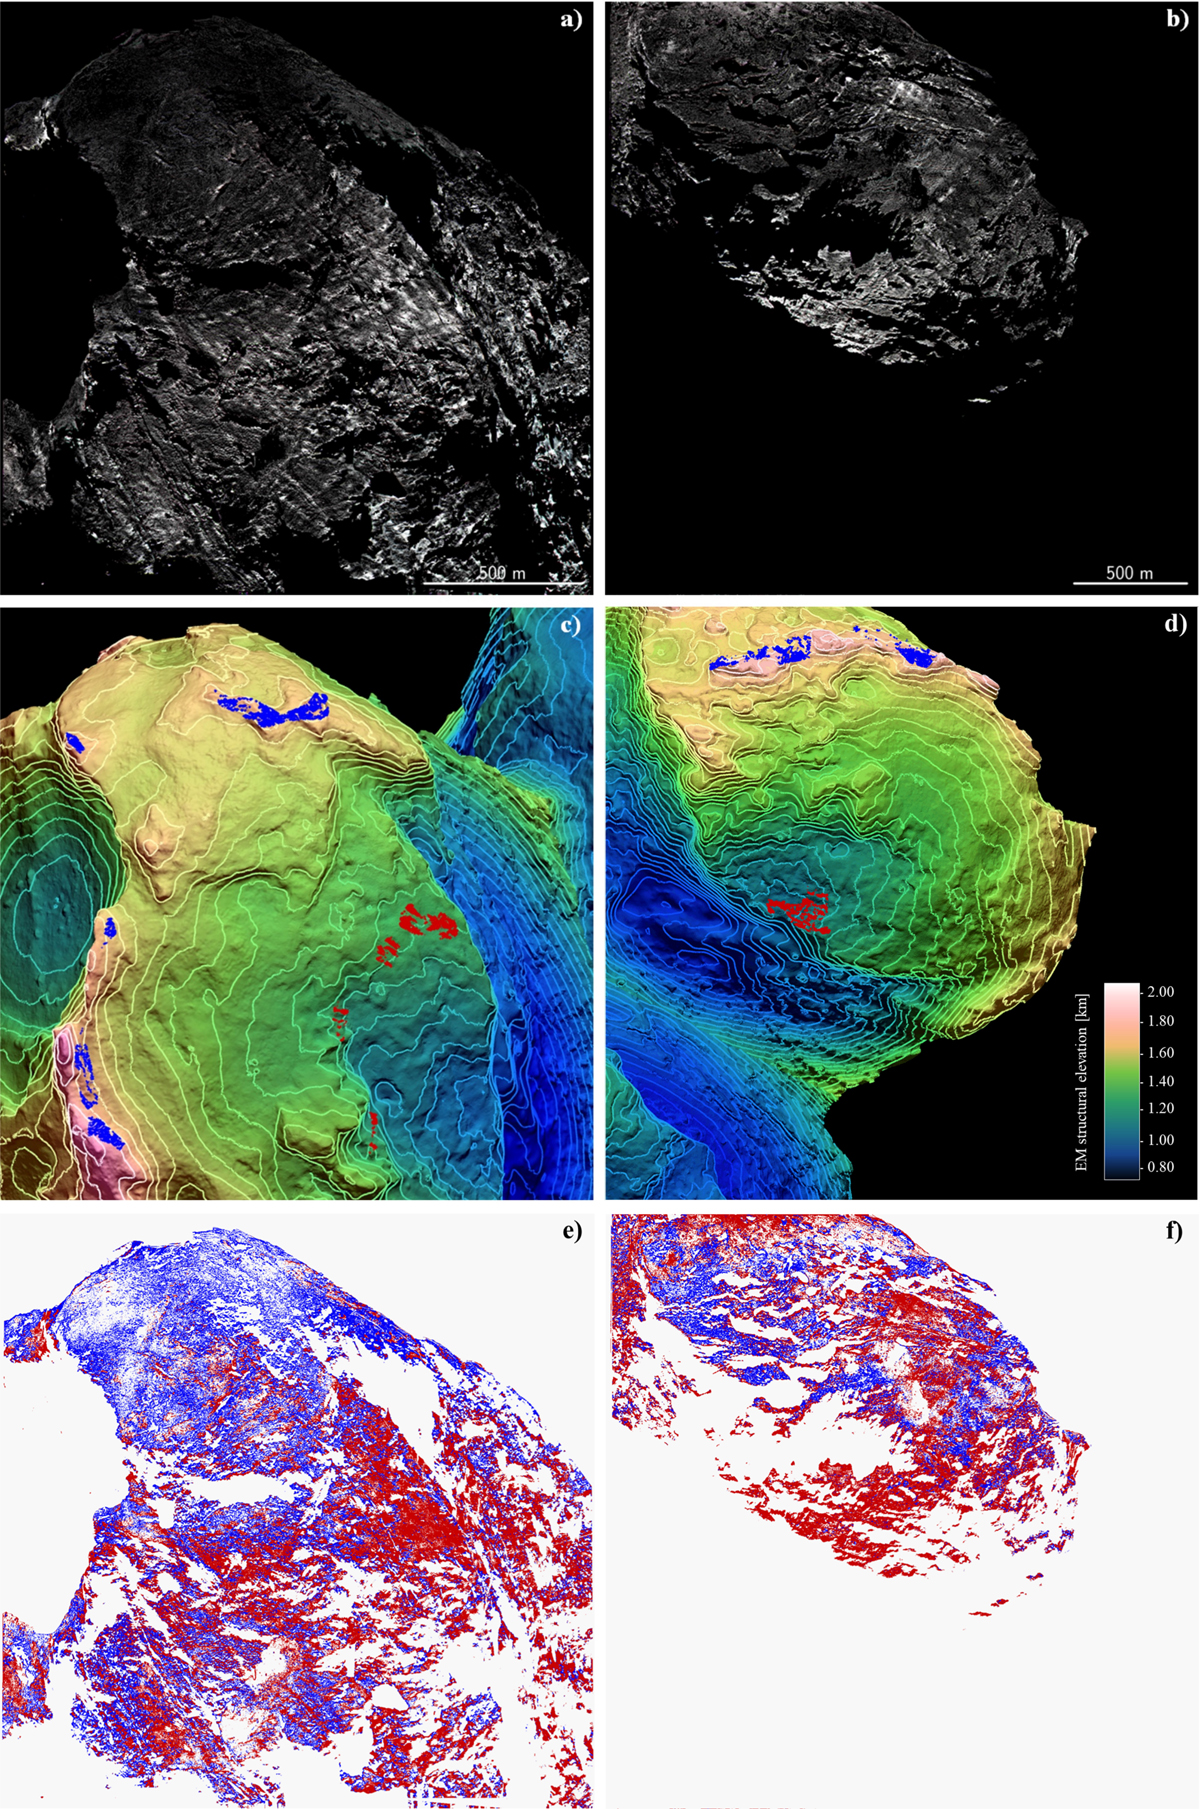
Panels a and b: false-color images (red, green, and blue correspond to filters 28, 23, and 24 centered at 743.7 nm, 535.7 nm, and 480.7 nm, respectively) obtained from multispectral images for both datasets in which the fine materials have been masked. Panels c and d: elevation model overlapped by the ROIs that were created according to structural elevation: red and blue ROIs correspond to the inner and outer class, respectively. Panels e and f: maximum likelihood supervised classification performed on consolidated materials and coarse deposits. Red and blue boxes identify the inner and outer class, respectively.
Current usage metrics show cumulative count of Article Views (full-text article views including HTML views, PDF and ePub downloads, according to the available data) and Abstracts Views on Vision4Press platform.
Data correspond to usage on the plateform after 2015. The current usage metrics is available 48-96 hours after online publication and is updated daily on week days.
Initial download of the metrics may take a while.