Fig. 2
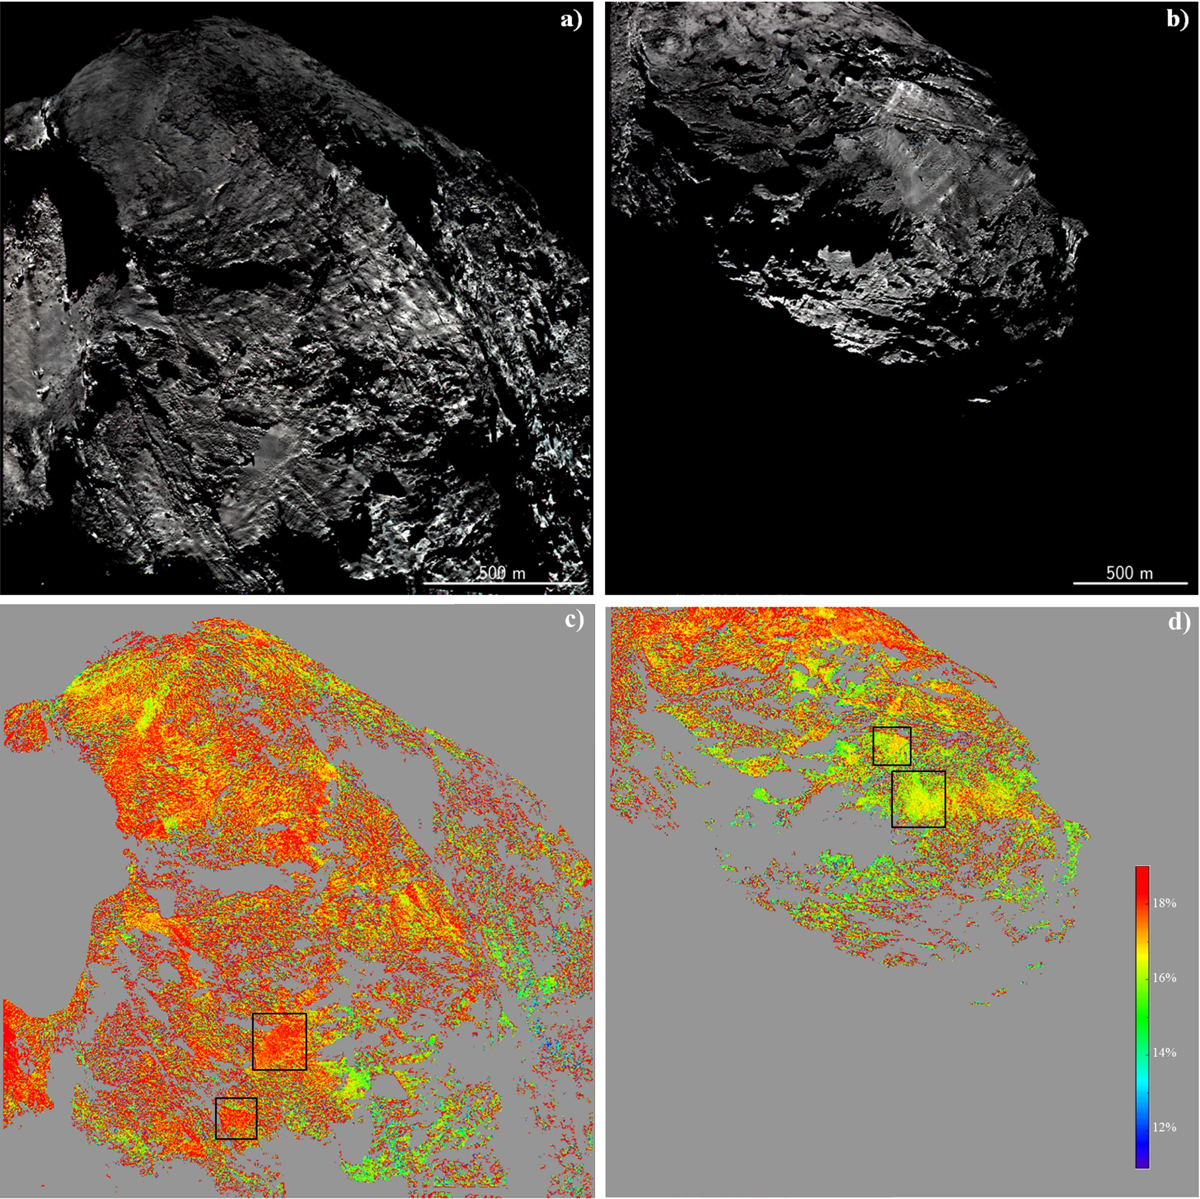
Panels a and b: false-colors images (red, green, and blue correspond to filters 28, 23, and 24, centered at 743.7 nm, 535.7 nm, and 480.7 nm, respectively) obtained by the multispectral images. Panels c and d: spectral slope maps for the two datasets obtained with Eq. (2); the black boxes frame the same areas of fine material deposits; they show different spectral slope values.
Current usage metrics show cumulative count of Article Views (full-text article views including HTML views, PDF and ePub downloads, according to the available data) and Abstracts Views on Vision4Press platform.
Data correspond to usage on the plateform after 2015. The current usage metrics is available 48-96 hours after online publication and is updated daily on week days.
Initial download of the metrics may take a while.