Fig. 8
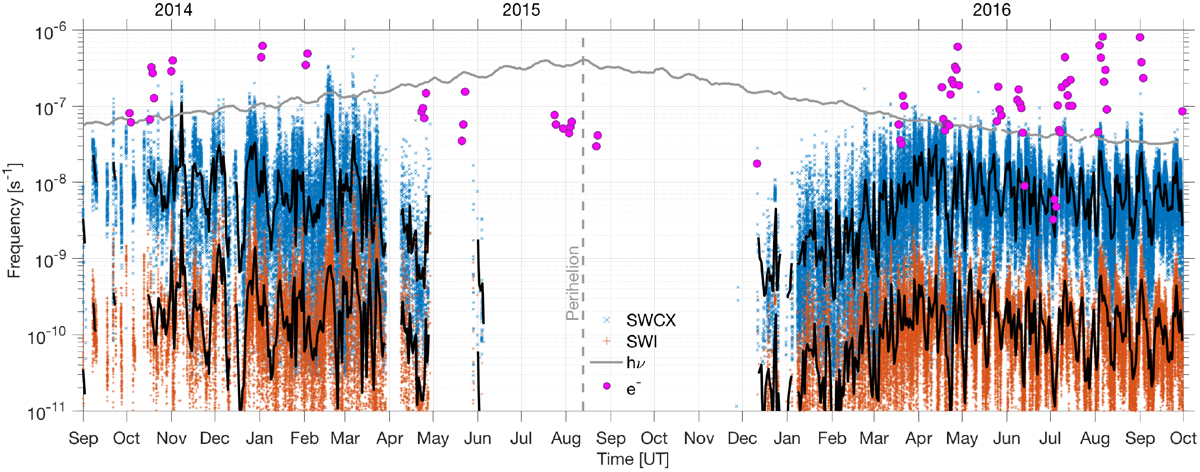
Local ionization production frequencies at comet 67P during the Rosetta mission (2014–2016). The contribution of SWCX (blue line), SWI (red lines), PI or (hν, 24 h average, gray line), and EI (or e−, 24 h average, pink circles) to the local production of ions is displayed. The black continuous lines are the 24 h averaged SWCX and SWI frequencies. When Rosetta was inside the solar wind ion cavity (May–December 2015), no solar wind fluxes could be routinely measured.
Current usage metrics show cumulative count of Article Views (full-text article views including HTML views, PDF and ePub downloads, according to the available data) and Abstracts Views on Vision4Press platform.
Data correspond to usage on the plateform after 2015. The current usage metrics is available 48-96 hours after online publication and is updated daily on week days.
Initial download of the metrics may take a while.