Fig. 8
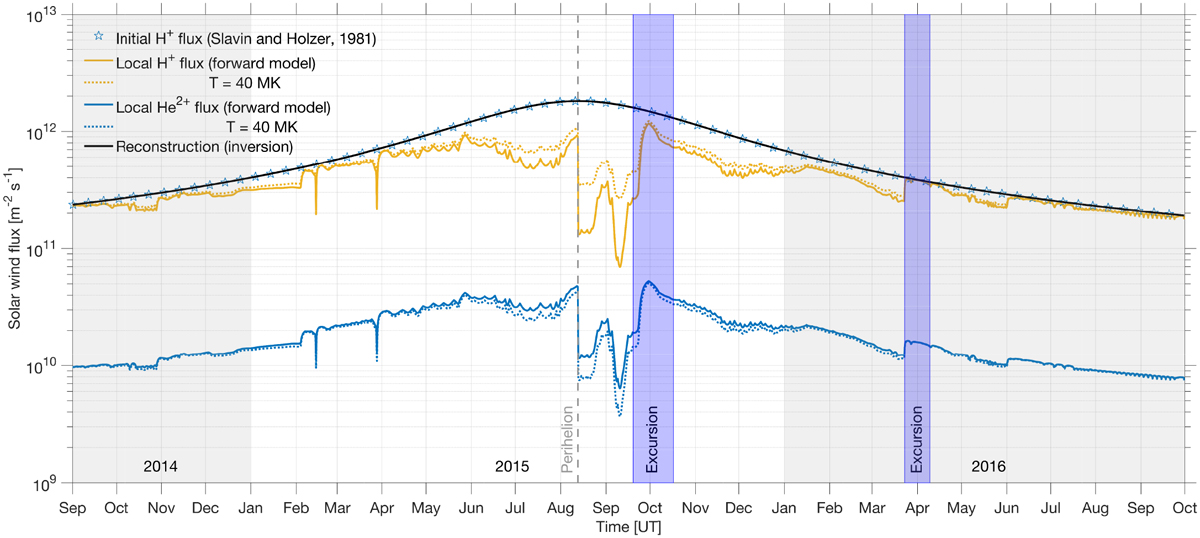
Solar wind flux reconstructed from the inversion of the analytical model compared to the original input solar wind upstream flux (Slavin & Holzer 1981) during the Rosetta mission (2014–2016). Proton and α particle fluxes (4% of the total solar wind ions) are considered. Dotted lines are results of the forward analytical model with a solar wind Maxwellian temperature T = 40 × 106 K. Otherwise, the caption is the same as for Fig. 7.
Current usage metrics show cumulative count of Article Views (full-text article views including HTML views, PDF and ePub downloads, according to the available data) and Abstracts Views on Vision4Press platform.
Data correspond to usage on the plateform after 2015. The current usage metrics is available 48-96 hours after online publication and is updated daily on week days.
Initial download of the metrics may take a while.