Fig. 7
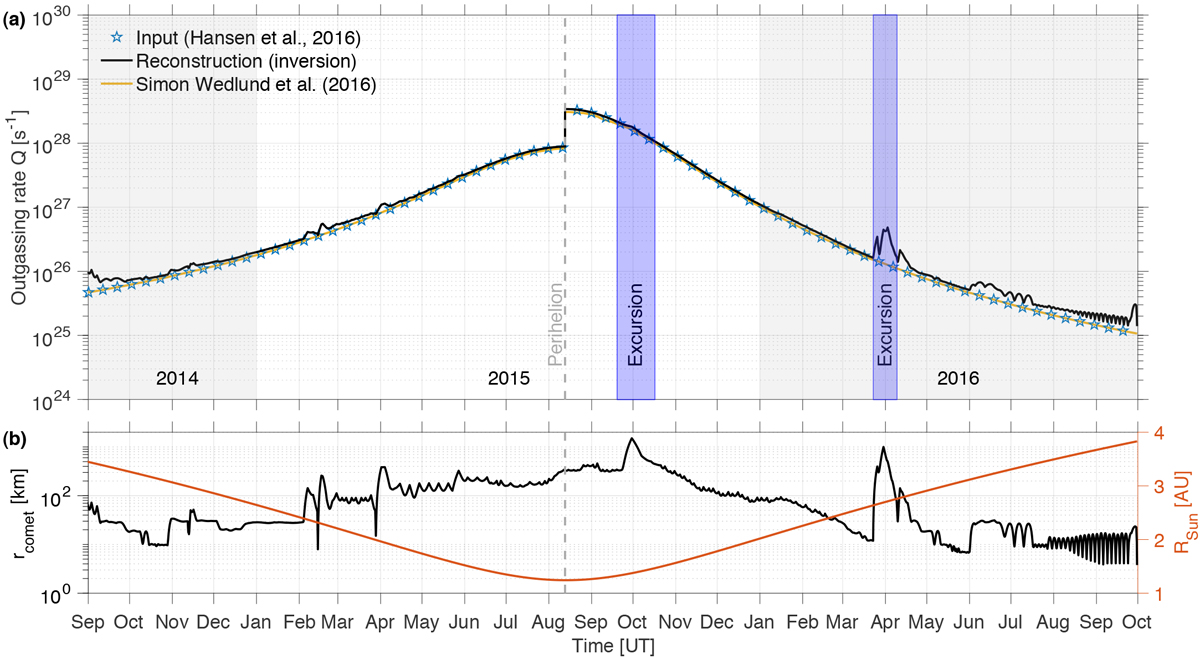
Panel a: outgassing rate Q0 reconstructed from the inversion of the analytical model (black line), compared to the original input outgassing rate (Hansen et al. 2016; blue stars) during the Rosetta mission (2014–2016). The orange line is the result of the simplified approach of Eq. (25) where only He2+ →He+ reactions were considered (Simon Wedlund et al. 2016); this method works well at the constant solar wind speed of 400 km s−1 chosen here.Panel b: geometry parameters of the spacecraft Rosetta at comet 67P during its two-year mission: black, cometocentric distance; red, heliocentric distance. Two large cometocentric distance excursions are indicated in blue: the dayside excursion (September–October 2015), and the cometary tail excursion (March–April 2016). Gray-shaded regions mark years.
Current usage metrics show cumulative count of Article Views (full-text article views including HTML views, PDF and ePub downloads, according to the available data) and Abstracts Views on Vision4Press platform.
Data correspond to usage on the plateform after 2015. The current usage metrics is available 48-96 hours after online publication and is updated daily on week days.
Initial download of the metrics may take a while.