Fig. 6
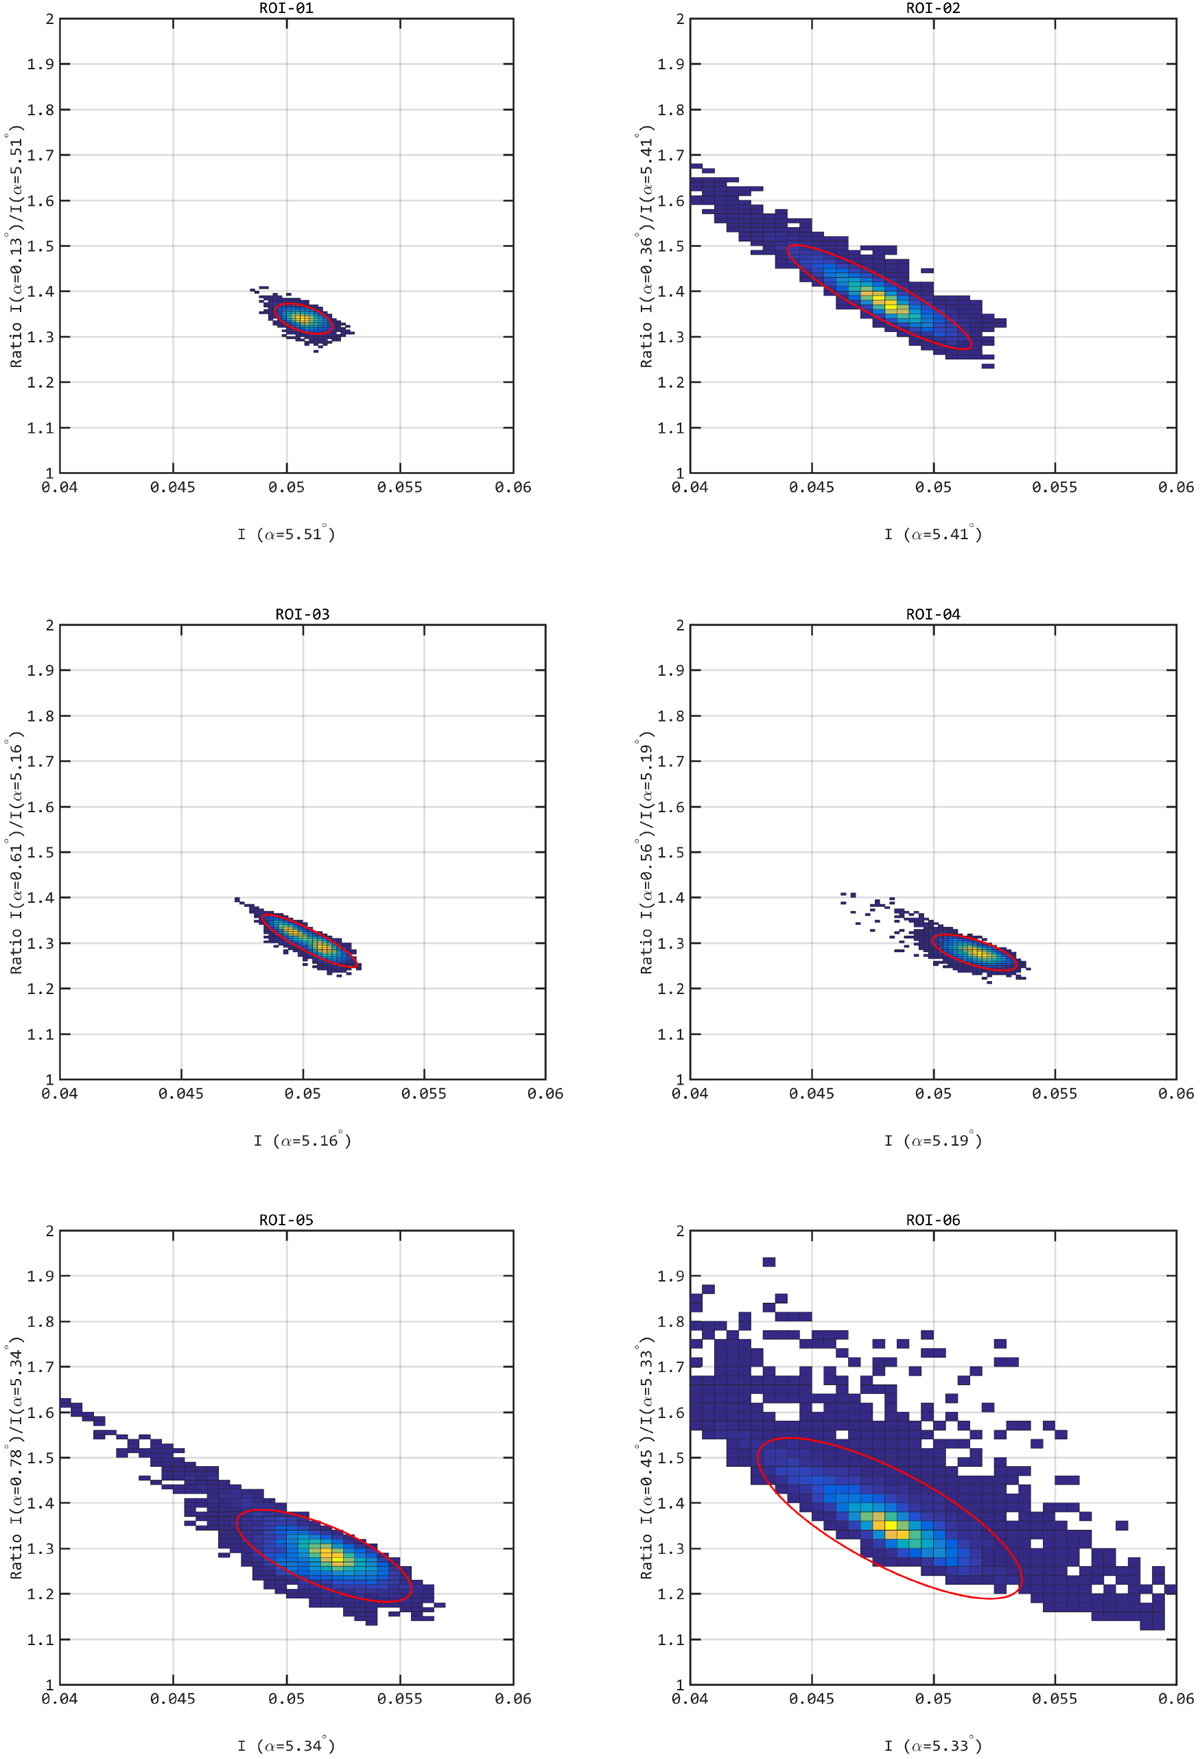
2D histogram of phase ratio vs. reflectance at angle α2 for each ROIat λ = 649.2 nm. The phase ratios were collected from images acquired at α1 ~ 0° and α2 ~ 5°. The corresponding reflectance was measured for the higher phase angle, α2. The color scale represents the number of data points within the bin, from high (yellow) to low (dark blue). The solid red line shows the 95% confidence ellipse.
Current usage metrics show cumulative count of Article Views (full-text article views including HTML views, PDF and ePub downloads, according to the available data) and Abstracts Views on Vision4Press platform.
Data correspond to usage on the plateform after 2015. The current usage metrics is available 48-96 hours after online publication and is updated daily on week days.
Initial download of the metrics may take a while.