Fig. 3
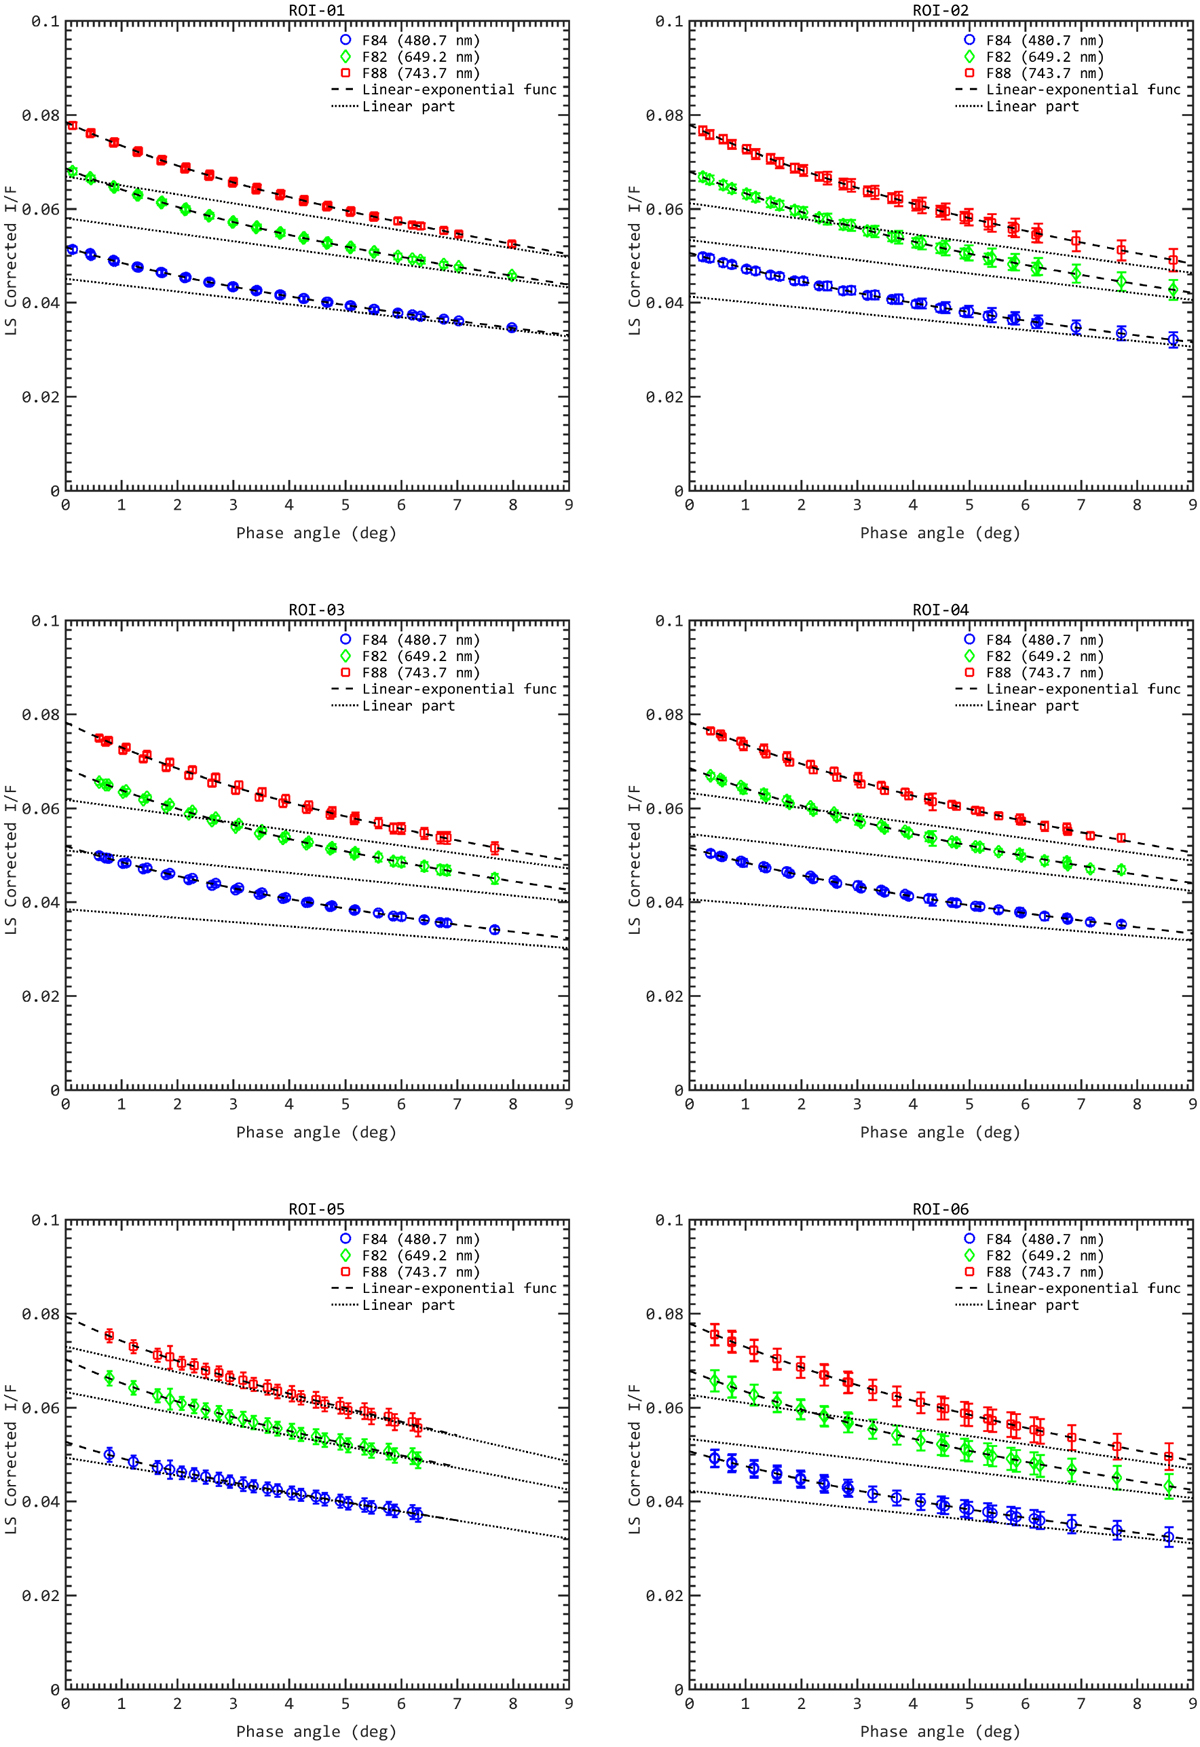
Phasecurves of six ROIs that are extracted from the Ash-Khepry-Imhotep region of 67P at three wavelengths 480.7 nm (blue), 649.2 nm (green), and 743.7 nm (red). The phase curves span a small phase angle range (α < 10°). The dash lines represent the fitted linear-exponential model (Fig. 1). The dotted lines show a linear phase law.
Current usage metrics show cumulative count of Article Views (full-text article views including HTML views, PDF and ePub downloads, according to the available data) and Abstracts Views on Vision4Press platform.
Data correspond to usage on the plateform after 2015. The current usage metrics is available 48-96 hours after online publication and is updated daily on week days.
Initial download of the metrics may take a while.