Fig. 8
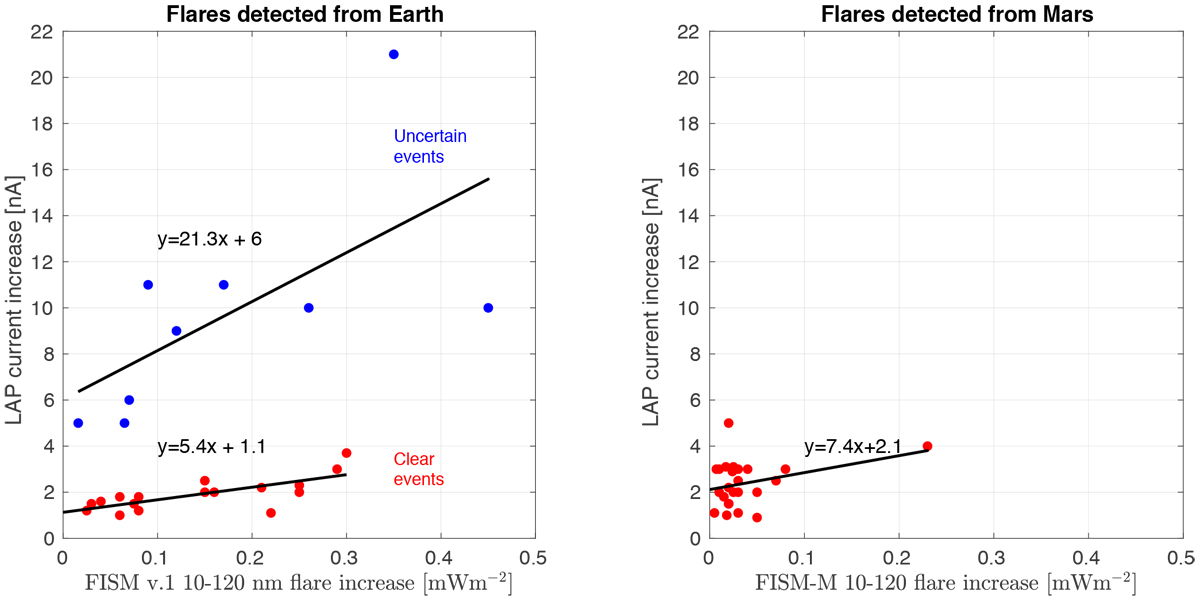
LAP current increase as a function of flare EUV irradiance increase for (left) solar flares identified from the vantage point of Earth and (right) for solar flares directed toward Mars. The red group in the left panel corresponds to the events that are easier to identify, while the blue group corresponds to some larger events that are harder to identify because the plasma environment is more dynamic. The upper lineis a fit to all blue points. The error in the FISM v.1 and FISM-M EUV values is roughly 40% and the error in the LAP current increase is estimated to be of similar size. Left panel: R2 = 0.53 for the fit to the “clear” event and R2 = 0.41 for the “unclear events”. Right panel: R2 = 0.12 for the fit.
Current usage metrics show cumulative count of Article Views (full-text article views including HTML views, PDF and ePub downloads, according to the available data) and Abstracts Views on Vision4Press platform.
Data correspond to usage on the plateform after 2015. The current usage metrics is available 48-96 hours after online publication and is updated daily on week days.
Initial download of the metrics may take a while.