Fig. 5
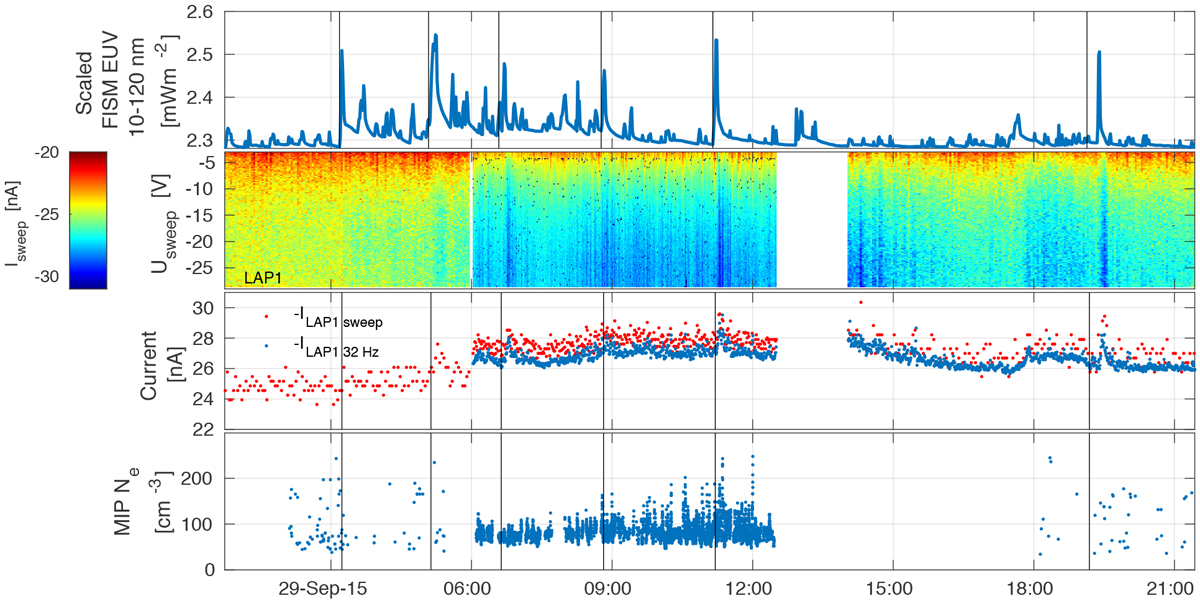
Examples of flares during the Rosetta dayside excursion (interval D in Fig. 5). The format is the same as in the previous Fig. 4, but an additional panel is added showing the electron density as measured by the MIP instrument on Rosetta. In the third panel, we also show the current measured at a fixed negative bias voltage of −30 V, which was available intermittently in this interval. Six flares are highlighted by black vertical lines, and all of them cause an increase in the measured current. Any increase in plasma density due to the flares is challenging to separate from the overall variability.
Current usage metrics show cumulative count of Article Views (full-text article views including HTML views, PDF and ePub downloads, according to the available data) and Abstracts Views on Vision4Press platform.
Data correspond to usage on the plateform after 2015. The current usage metrics is available 48-96 hours after online publication and is updated daily on week days.
Initial download of the metrics may take a while.