Fig. 4
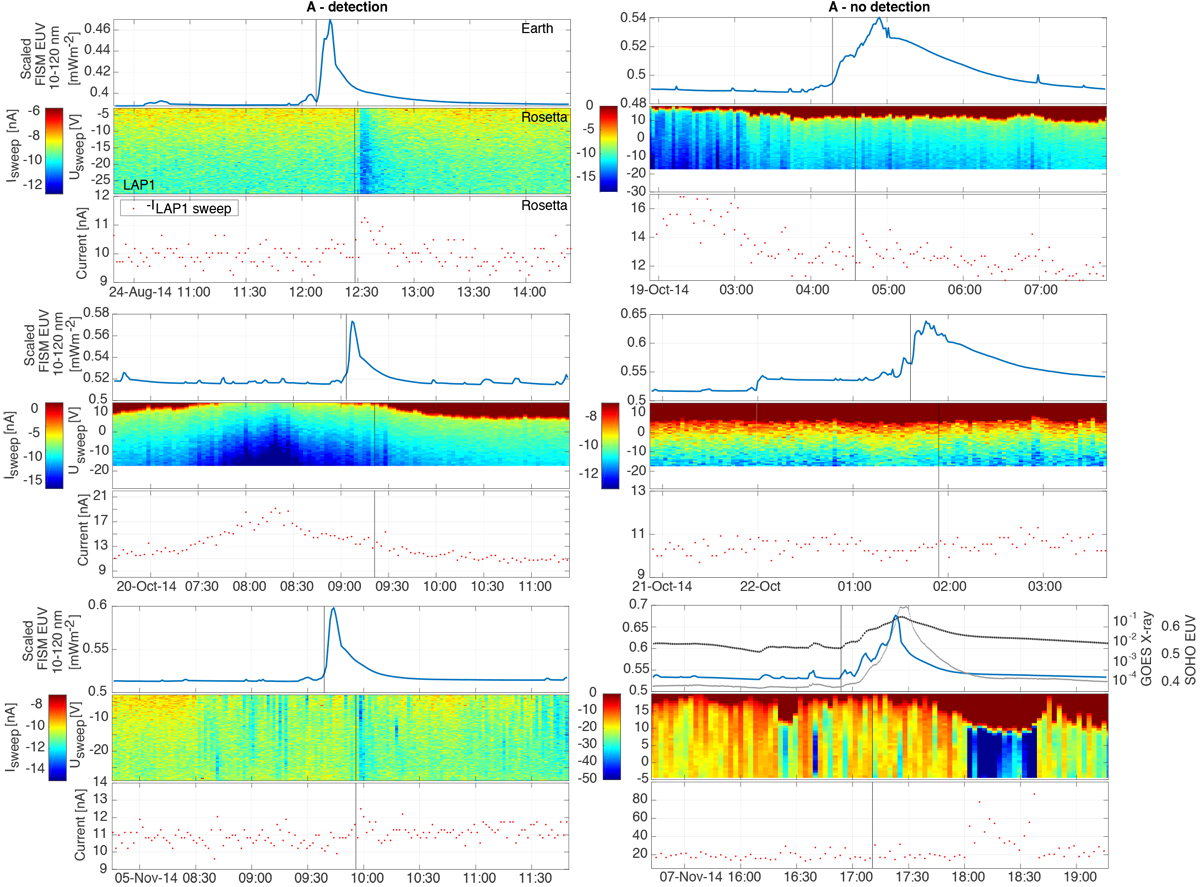
Six examples of flares and their effects, and lack of observable effects, in Rosetta data. In each of the six cases, top panels: FISM v.1 irradiance; middle panels: LAP sweeps, where the collected current is color-coded and the applied bias voltage is indicated on the vertical axis. Lower panels: current from the maximum negative bias voltage from the sweeps. A change in current is due to a change in either plasma density or photoelectron emission. The black vertical line in the top panel indicates the onset of the flares at Earth, and in the lower two panels, this line has been time-shiftedby the speed of light travel time from Earth to Rosetta. The scales on the axes change between all six examples. In the lower right example we have added the X-ray irradiance at 0.1–0.8 nm from GOES (black, in units of 1010 cm−2 s−1) as well as EUV fluxes at 1–50 nm from SOHO (gray, in units of mW m−2) to show an example of the timing of the same event in different wavelength bands.
Current usage metrics show cumulative count of Article Views (full-text article views including HTML views, PDF and ePub downloads, according to the available data) and Abstracts Views on Vision4Press platform.
Data correspond to usage on the plateform after 2015. The current usage metrics is available 48-96 hours after online publication and is updated daily on week days.
Initial download of the metrics may take a while.