Fig. 1
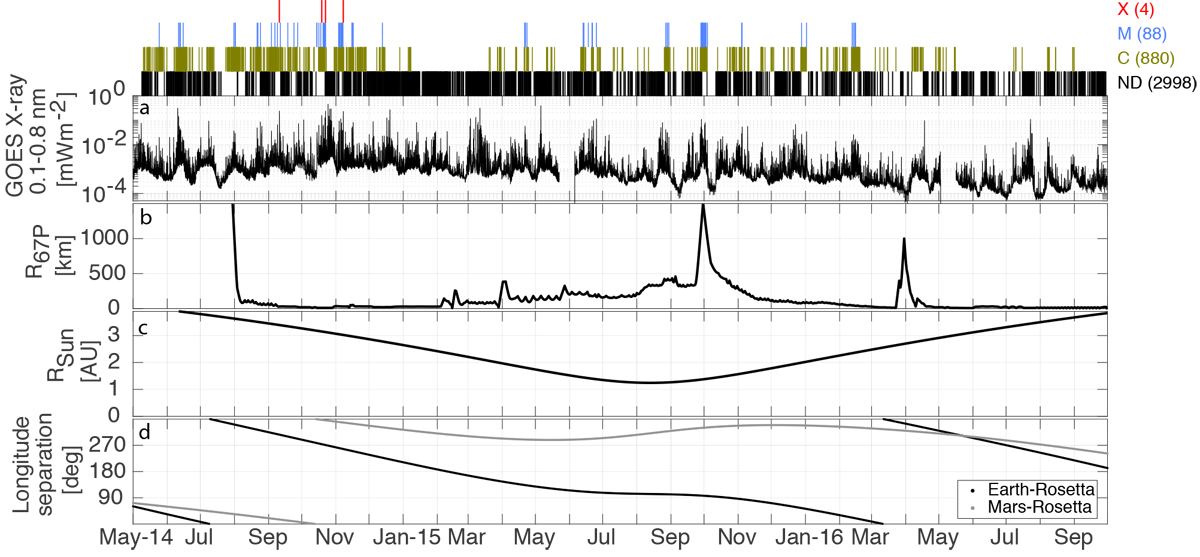
Time series of (a) GOES measured X-ray irradiance (where each peak corresponds to a flare), (b) Rosetta’s distance to the comet nucleus, (c) the heliocentric distance of Rosetta, and (d) the heliospheric longitudinal separation between Rosetta andEarth as well as between Rosetta and Mars. The colored vertical lines at the top indicate the cataloged C, M, and X class flares that were observed at Earth and occurred during the Rosetta mission, which were also directed such that Rosetta could observe them. Those that were not detectable (ND) because of the geometry (too far out on the limb of the Sun) are indicated by the black lines.
Current usage metrics show cumulative count of Article Views (full-text article views including HTML views, PDF and ePub downloads, according to the available data) and Abstracts Views on Vision4Press platform.
Data correspond to usage on the plateform after 2015. The current usage metrics is available 48-96 hours after online publication and is updated daily on week days.
Initial download of the metrics may take a while.