Fig. 6
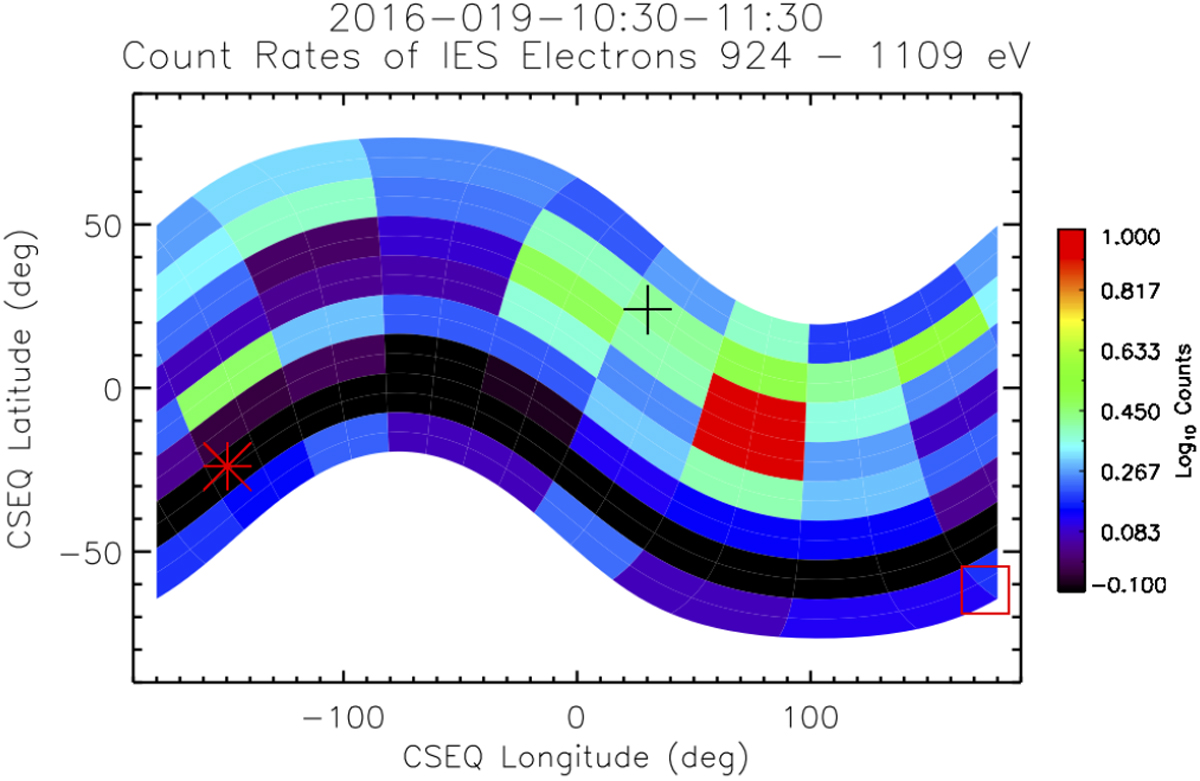
CSEQplot of 16 × 16 IES electron pixel count-rates for the energy range 924–1109 eV for 19 January 2016, 10:30–11:30 UT. The red square gives the location of 67P in the IES FOV. The black plus and the red asterisk give the location of the intersection of the average magnetic field vector and the IES FOV. Movie available online.
Current usage metrics show cumulative count of Article Views (full-text article views including HTML views, PDF and ePub downloads, according to the available data) and Abstracts Views on Vision4Press platform.
Data correspond to usage on the plateform after 2015. The current usage metrics is available 48-96 hours after online publication and is updated daily on week days.
Initial download of the metrics may take a while.