Free Access
Fig. 10
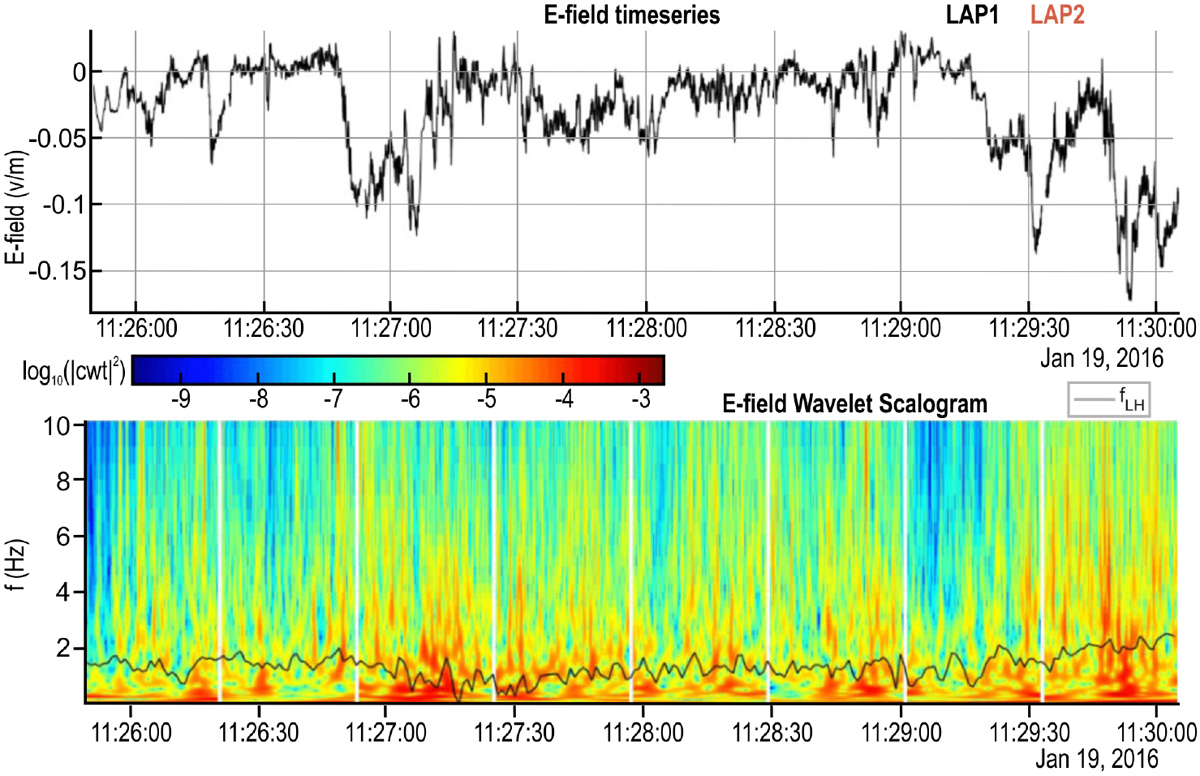
Electric waves measured by the Langmuir probe on 19 January 2016 at the end of the interval 10:30 to 11:30. Top plot: measured electric field (V m−1). Bottom plot: scalogram of the resulting frequency. The black line near the bottom gives the LH wave frequency.
Current usage metrics show cumulative count of Article Views (full-text article views including HTML views, PDF and ePub downloads, according to the available data) and Abstracts Views on Vision4Press platform.
Data correspond to usage on the plateform after 2015. The current usage metrics is available 48-96 hours after online publication and is updated daily on week days.
Initial download of the metrics may take a while.