Fig. 4.
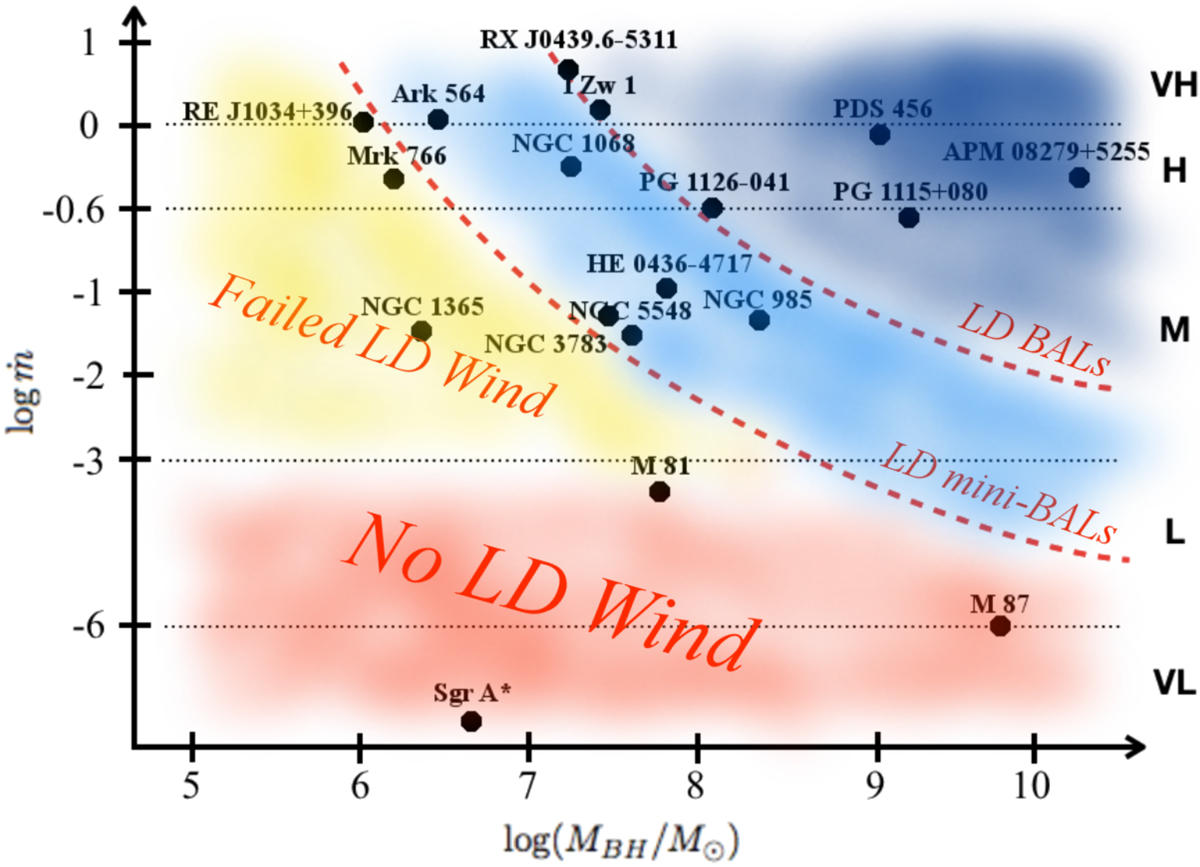
Eddington ratio ṁ and black hole mass MBH parameter space with the five different ṁ regimes marked by dotted lines (note that the vertically logarithmic scale is nonlinear). The two dashed curves mark approximately the lower limit in the ṁ − MBH space for the existence of UV LD mini-BALs (bottom curve) and BALs (upper curve). The location of various AGN mentioned in this article is marked in the figure. References for the individual measurements of log(MBH/M⊙) and ṁ (or LBOL, assuming η = 0.1 for luminous AGN) are taken from the literature and reported in parentheses, respectively from: Botte et al. (2004) and Kara et al. (2017) for Ark 564 (6.4, 1.1); Vestergaard & Peterson (2006) and Martínez-Paredes et al. (2017) for I Zw 1 (7.4, 1.4); Bentz et al. (2009) and Vasudevan et al. (2010) for Mrk 766 (6.2, 0.4*); Greenhill et al. (1996) for NGC 1068 (7.2, 0.5); Risaliti et al. (2013) and Vasudevan et al. (2010) for NGC 1365 (6.3, 0.025); Pancoast et al. (2014) and Vasudevan et al. (2010) for NGC 5548 (7.6, 0.025); Grupe et al. (2010) and Middei et al. (2018) for HE 0436−4717 (7.8, 0.09); Dasyra et al. (2007) and Giustini et al. (2011) for PG 1126−041 (8.1, 0.25); Peng et al. (2006) and Chartas et al. (2007) for PG 1115+080 (9.1, 0.2); Saturni et al. (2018) for APM 08279+5255 (10.4, 0.4); Nardini et al. (2015) for PDS 456 (9, 0.8); Jin et al. (2017a) for RX J0439.6−5311 (7.2, 1.8), Czerny et al. (2016) for RE J1034+396 (6, 1); Vasudevan et al. (2010) for NGC 985 (8.4, 0.05); Vasudevan et al. (2010) for NGC 3783 (7.5, 0.05); Devereux et al. (2003) and Ho et al. (1996) for M 81 (7.8, 6 × 10⁻⁴); Gebhardt & Thomas (2009)Prieto et al. (2016) for M 87 (9.8, 10−6); and Ghez et al. (2008) and Mościbrodzka et al. (2009) for Sgr A* (6.6, < 10−6). (*) Vasudevan et al. (2010) estimate a lower ṁ for Mrk 766 as they use a larger BH mass than the one used here.
Current usage metrics show cumulative count of Article Views (full-text article views including HTML views, PDF and ePub downloads, according to the available data) and Abstracts Views on Vision4Press platform.
Data correspond to usage on the plateform after 2015. The current usage metrics is available 48-96 hours after online publication and is updated daily on week days.
Initial download of the metrics may take a while.