Fig. 1.
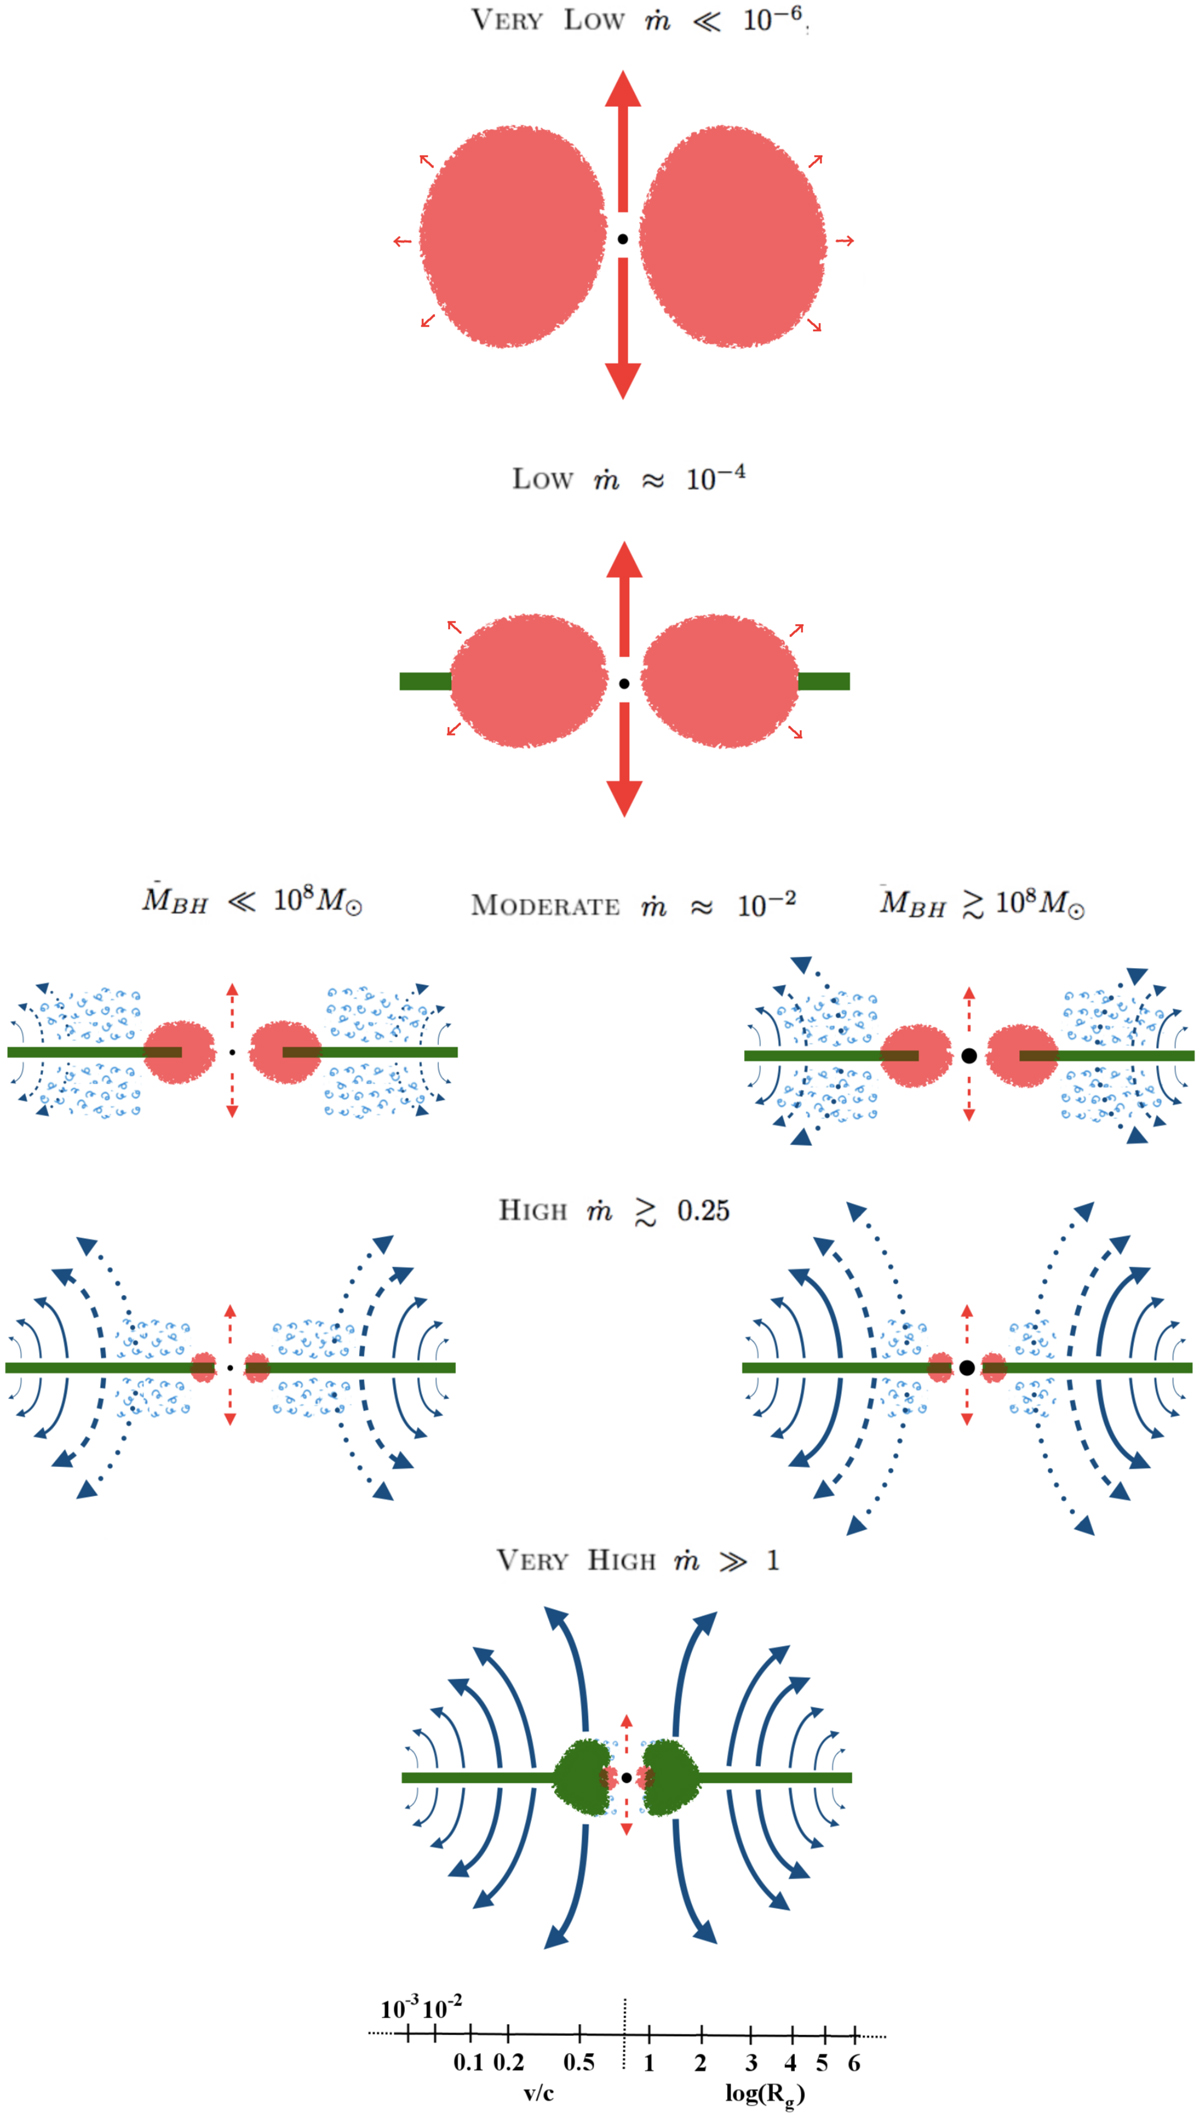
Logarithmic-scale side view of the inner parsec of the accretion and ejection flow of AGN for five regimes of ṁ that increase from top to bottom. We plot in light red the hot, optically thin accretion flow; in green the cold, optically thick accretion flow; in red we plot the magnetically driven ejection flow streamlines; in blue the radiation-driven accretion disk wind and failed wind streamlines. In the optically thick, geometrically thin disk dominated cases, two extremes of very small (left) and very large (right) MBH are presented. The length and thickness of the arrows reflect the strength of the wind in terms of terminal velocity. From the closest to the farthest arrow to the central SMBH, velocities decrease from ∼c of the radio jet, to the ∼0.4c of the fastest UFOs launched at r ∼ 10rg, to the ∼0.1 − 0.2c typical of BALs and mini-BALs launched at r ∼ 102 − 103rg, to ∼0.01 − 0.1c of the BALs and mini-BALs launched at r ∼ 103 − 104rg, out to ∼0.001c of low-velocity NALs launched at r > 104rg. Solid lines represent streamlines of persistent winds, while dashed and dotted lines represent streamlines of transient, sporadic ejection flows; the blue wiggly little clouds represent flow streamlines of the completely failed wind. The actual duty cycle of the wind is still uncertain, and its determination is the subject of current observational and theoretical efforts.
Current usage metrics show cumulative count of Article Views (full-text article views including HTML views, PDF and ePub downloads, according to the available data) and Abstracts Views on Vision4Press platform.
Data correspond to usage on the plateform after 2015. The current usage metrics is available 48-96 hours after online publication and is updated daily on week days.
Initial download of the metrics may take a while.