Fig. 4
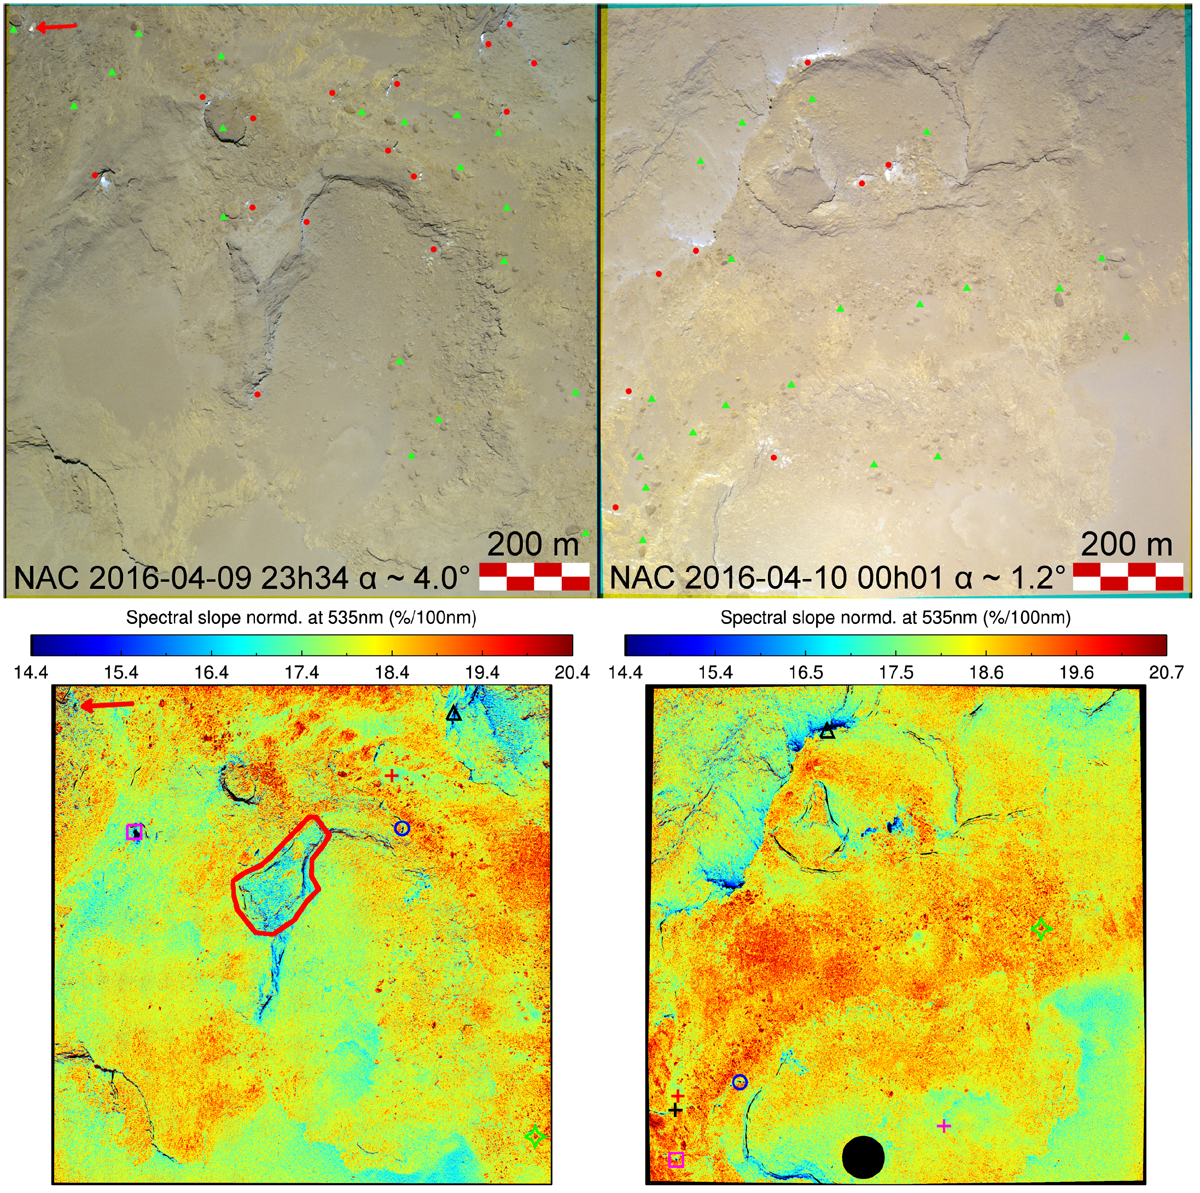
Top: panel of RGBs produced from 480, 639, and 743 nm NAC filter images taken during the flyby. For clarity, the 2016-04-10T00h01 image has been rotated anticlockwise by 90°. The positions of the bright surfaces discussed in the main text are denoted by red circles, while locations of groups of somber boulders are marked by green triangles. Bottom: panel of the spectral slopes in the 535–743 nm range for the NAC images presented in Fig. 7. The black circle in the right mapping encloses the surface elements for which the phase angle is lower than 0.095°. The symbols used in each image correspond to the surface elements investigated in Fig. 8. See main text for details regarding the black and pink crosses and for the central cuesta structure encircled here in red. The red arrow points to the position of bright spot 44 in Deshapriya et al. (2018).
Current usage metrics show cumulative count of Article Views (full-text article views including HTML views, PDF and ePub downloads, according to the available data) and Abstracts Views on Vision4Press platform.
Data correspond to usage on the plateform after 2015. The current usage metrics is available 48-96 hours after online publication and is updated daily on week days.
Initial download of the metrics may take a while.