Fig. 11
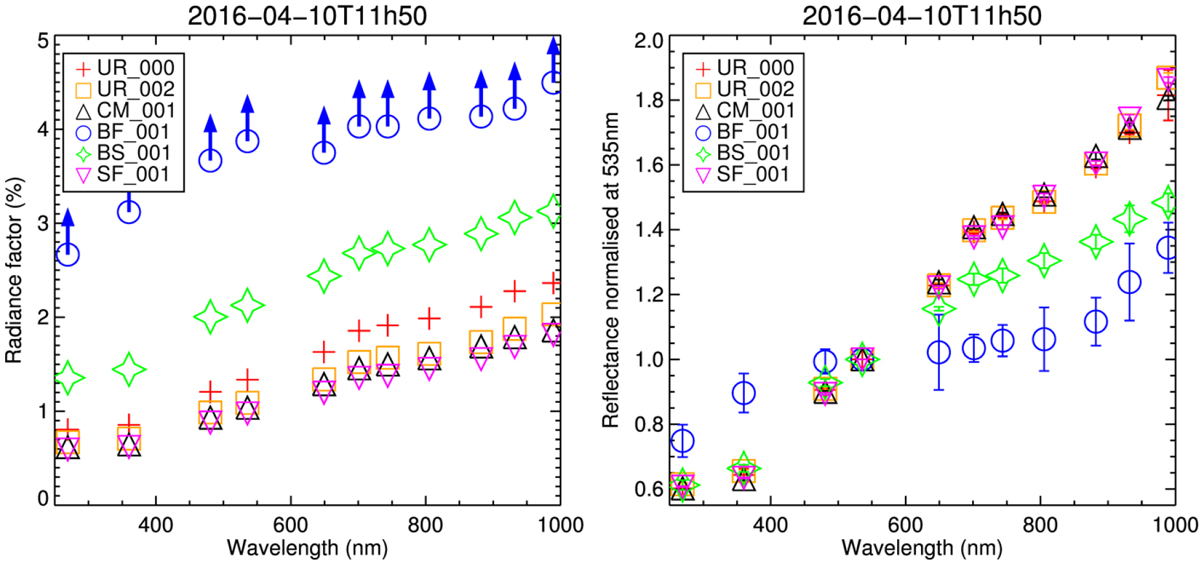
Spectrophotometry measurements for the 2016-04-10T11h48 sequence. The images were photometrically corrected using the Lommel–Seeliger disk law. The symbols correspond to the measurements made at the locations indicated in Fig. 10a. We note here that the measures for BF-01 were close to the detector saturation levels. These values therefore correspond to lower limits.
Current usage metrics show cumulative count of Article Views (full-text article views including HTML views, PDF and ePub downloads, according to the available data) and Abstracts Views on Vision4Press platform.
Data correspond to usage on the plateform after 2015. The current usage metrics is available 48-96 hours after online publication and is updated daily on week days.
Initial download of the metrics may take a while.