Fig. 1
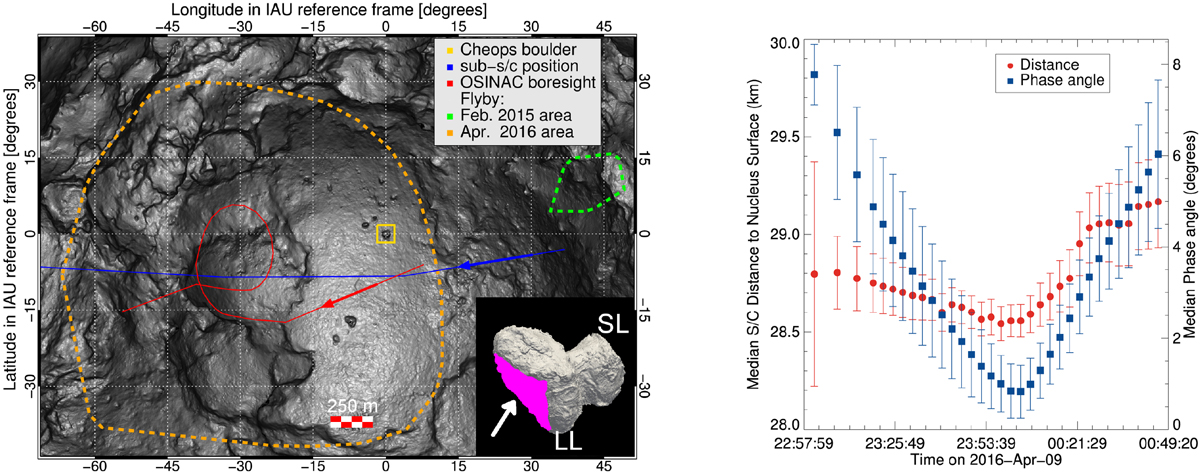
Context of 9–10 April 2016. Left, inset: position of the Imhotep depression (in pink) with respect to the comet large lobe (LL) and small lobe (SL) main: cylindrical projection centered on the Cheops boulder (gold square) of the Imhotep region, see main text for more details. Right: curves of the median distance to the surface and median phase angle around the moment of closest approach during the flyby. The uncertainties correspond to the standard deviation of the values across each observation.
Current usage metrics show cumulative count of Article Views (full-text article views including HTML views, PDF and ePub downloads, according to the available data) and Abstracts Views on Vision4Press platform.
Data correspond to usage on the plateform after 2015. The current usage metrics is available 48-96 hours after online publication and is updated daily on week days.
Initial download of the metrics may take a while.