Fig. 9.
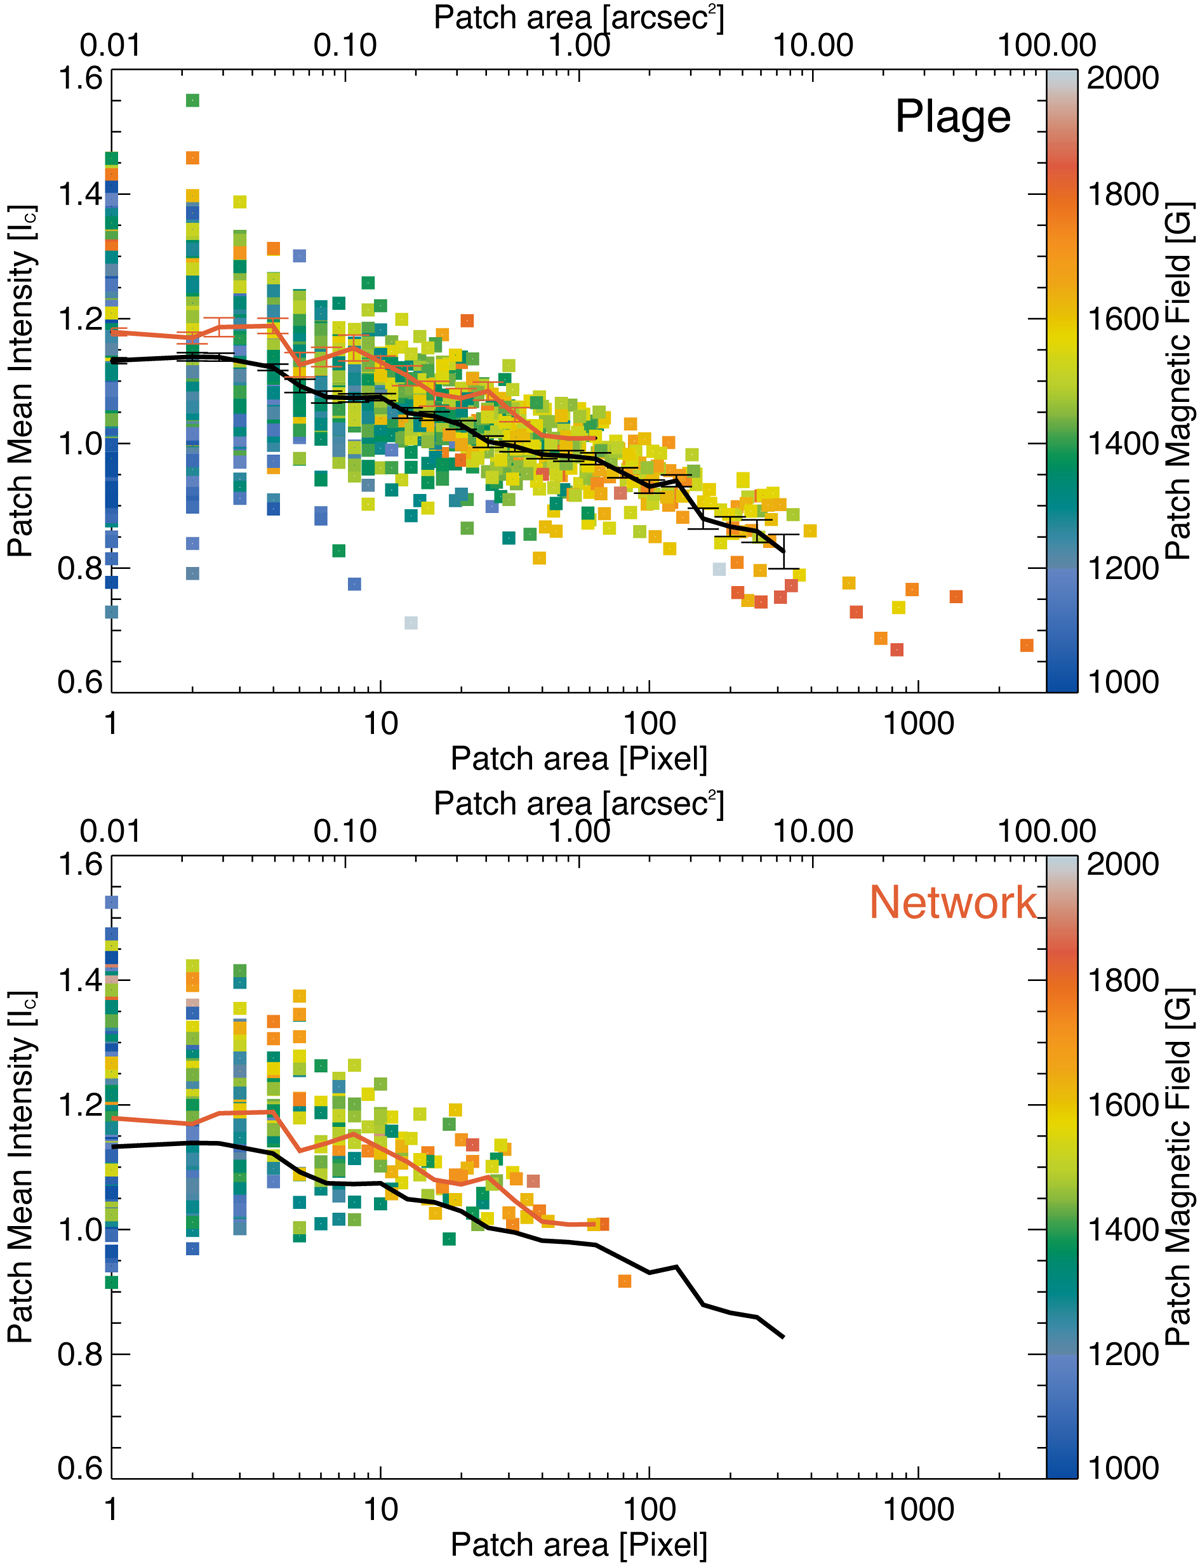
Scatterplot of patch areas of kG features and their mean continuum intensity in the plage, top, and the network, bottom. The black and red solid lines indicate the plage and network mean continuum intensities respectively. The mean intensities were calculated using ten logarithmic bins per decade of patch area. The error bars refer to the error of the mean.
Current usage metrics show cumulative count of Article Views (full-text article views including HTML views, PDF and ePub downloads, according to the available data) and Abstracts Views on Vision4Press platform.
Data correspond to usage on the plateform after 2015. The current usage metrics is available 48-96 hours after online publication and is updated daily on week days.
Initial download of the metrics may take a while.