Fig. 5.
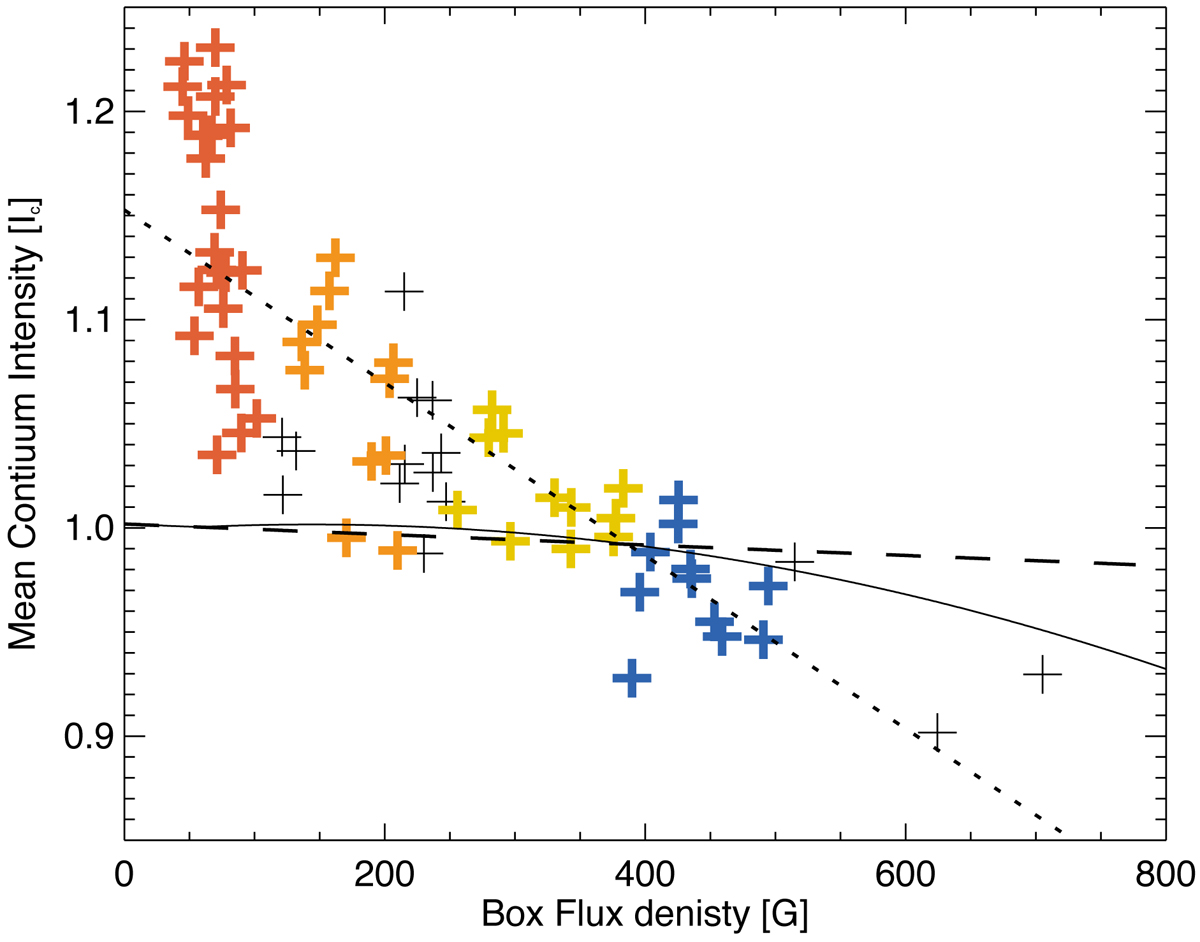
Correlation between an area’s flux density and its mean continuum intensity. The plus symbols show the mean continuum intensity of kG pixels within each box. The coloured crosses indicate the boxes that were summed for the similarly coloured distributions in Figs. 7, 8, and 14. The dotted line is a linear fit to the mean continuum intensity of kG pixels. The dashed line displays a linear fit to the mean continuum intensity of sub-kG pixels. The solid line shows the mean continuum intensity of all pixels in a box.
Current usage metrics show cumulative count of Article Views (full-text article views including HTML views, PDF and ePub downloads, according to the available data) and Abstracts Views on Vision4Press platform.
Data correspond to usage on the plateform after 2015. The current usage metrics is available 48-96 hours after online publication and is updated daily on week days.
Initial download of the metrics may take a while.